
Mastering Xcode 4: Develop and Design
Joshua Nozzi

Mastering Xcode 4: Develop and Design
Joshua Nozzi
Peachpit Press
1249 Eighth Street
Berkeley, CA 94710
510/524-2178
510/524-2221 (fax)
Find us on the Web at: www.peachpit.com
To report errors, please send a note to [email protected]
Peachpit Press is a division of Pearson Education
Copyright © 2012 by Joshua Nozzi
Editor: Cliff Colby
Production editor: Myrna Vladic
Development editor: Kim Wimpsett and Robyn G. Thomas
Copyeditor: Scout Festa
Technical Editor: Duncan Campbell
Cover design: Aren Howell Straiger
Interior design: Mimi Heft
Compositor: David Van Ness
Indexer: Ann Rogers
Notice of Rights
All rights reserved. No part of this book may be reproduced or transmitted in any form by any means, electronic, mechanical, photocopying, recording, or otherwise, without the prior written permission of the publisher. For information on getting permission for reprints and excerpts, contact [email protected].
Notice of Liability
The information in this book is distributed on an “As Is” basis, without warranty. While every precaution has been taken in the preparation of the book, neither the author nor Peachpit Press shall have any liability to any person or entity with respect to any loss or damage caused or alleged to be caused directly or indirectly by the instructions contained in this book or by the computer software and hardware products described in it.
Trademarks
Xcode is a trademark of Apple Inc., registered in the United States and other countries. Many of the designations used by manufacturers and sellers to distinguish their products are claimed as trademarks. Where those designations appear in this book, and Peachpit Press was aware of a trademark claim, the designations appear as requested by the owner of the trademark. All other product names and services identified throughout this book are used in editorial fashion only and for the benefit of such companies with no intention of infringement of the trademark. No such use, or the use of any trade name, is intended to convey endorsement or other affiliation with this book.
ISBN 13: 978-0-321-76752-3
ISBN 10: 0-321-76752-7
9 8 7 6 5 4 3 2 1
Printed and bound in the United States of America
Thanks to all my peers, friends, and family for their enthusiastic support,
to a great team of professionals for helping me reach this goal,
and to Matt for putting up with yet another of
my time-consuming projects.
Acknowledgments
I wish to thank the following people whose work I used while writing this book.
Cyril Godefroy
Cyril’s masterfully broken code examples demonstrated some nice highlights of the Clang Static Analyzer. You can find them at http://xcodebook.com/cgodefroy.
Colin Wheeler
Colin’s Xcode shortcut cheat sheet saved me loads of tedium when creating Appendix B. You can find the original, downloadable version that Colin maintains at http://xcodebook.com/cwheeler.
Contents
Introduction
Welcome to Xcode
PART I THE BASICS: GETTING STARTED WITH XCODE 4
CHAPTER 1 DISCOVERING XCODE TOOLS
Downloading
Installing
Exploring
Wrapping Up
CHAPTER 2 STARTING A PROJECT
Welcome to Xcode!
Creating a New Project
Project Modernization
Building and Running an Application
Wrapping Up
CHAPTER 3 NAVIGATING A PROJECT
The Workspace Window
The Navigator Area
The Jump Bar
The Editor Area
The Utility Area
The Debug Area
The Activity Viewer
The Tabs
The Organizer Window
Wrapping Up
CHAPTER 4 GETTING HELP
The Help Menu
The Organizer’s Documentation Tab
The Source Editor
Community Help and Feedback
Wrapping Up
PART II WORKING WITH COCOA APPLICATIONS
CHAPTER 5 CREATING USER INTERFACES
Understanding Nibs
Getting Familiar with Interface Builder
Adding User Interface Elements
Layout
Wrapping Up
CHAPTER 6 ADDING FILES TO A PROJECT
Adding Existing Files
Creating New Files
Using the File Template Library
Removing Files from the Project
Wrapping Up
CHAPTER 7 WRITING CODE WITH THE SOURCE EDITOR
Exploring the Source Editor Interface
Navigating Source Code
Using Code Completion
Exploring the Code Snippet Library
The Assistant
Wrapping Up
CHAPTER 8 SEARCHING AND REPLACING
Using the Search Navigator
Searching within Files
Wrapping Up
CHAPTER 9 BASIC DEBUGGING AND ANALYSIS
Compile-Time Debugging
Runtime Debugging
Wrapping Up
CHAPTER 10 USING THE DATA MODEL EDITOR
Introducing Core Data
Using the Data Model Editor
Creating a Basic Data Model
Creating a UI for the Model
Using the Assistant
Wrapping Up
CHAPTER 11 CUSTOMIZING THE APPLICATION ICON
Picking the Ideal Artwork
Creating Icons
Setting the Application Icon
Setting Document Icons
Wrapping Up
CHAPTER 12 DEPLOYING AN APPLICATION
Archiving
Alternatives to Archiving
Wrapping Up
PART III GOING BEYOND THE BASICS
CHAPTER 13 ADVANCED EDITING
Renaming Symbols
Refactoring
Organizing with Macros
Changing Editor Key Bindings
Jump to Definition
My Company Name
Wrapping Up
CHAPTER 14 THE BUILD SYSTEM
An Overview
Working with Targets
Working with Schemes
Entitlements (Sandboxing)
Wrapping Up
CHAPTER 15 LIBRARIES, FRAMEWORKS, AND LOADABLE BUNDLES
What are Libraries, Frameworks, and Bundles?
Using Existing Libraries and Frameworks
Creating a Framework
Wrapping Up
CHAPTER 16 WORKSPACES
What Is a Workspace?
When to Use a Workspace
Creating a Workspace
Another Kind of Workspace
Wrapping Up
CHAPTER 17 DEBUGGING AND ANALYSIS IN DEPTH
Using the Clang Static Analyzer
Exploring Analyzer Results
Threads and Stacks
Inspecting Memory
Conferring with the Console
Viewing Generated Output
Debugging Apps for iOS Devices
Wrapping Up
CHAPTER 18 UNIT TESTING
What is Unit Testing?
Unit Testing in Xcode
Writing a Unit Test
Adding Unit Tests to Existing Projects
Wrapping Up
CHAPTER 19 USING SCRIPTING AND PREPROCESSING
Extending Your Workflow with Custom Scripts
Using the Preprocessor
Wrapping Up
CHAPTER 20 USING INSTRUMENTS
An Overview of DTrace
A Tour of Instruments
Using Instruments for Common Tasks
Wrapping Up
CHAPTER 21 SOURCE CODE MANAGEMENT
Xcode Snapshots
Using an SCM System
Wrapping Up
Index
APPENDIX A MANAGING YOUR IOS DEVICES
APPENDIX B GESTURES AND KEYBOARD SHORTCUTS
APPENDIX C DOCUMENTATION UPDATES
APPENDIX D OTHER RESOURCES
Introduction
This book is an intermediate-level introduction to Xcode 4, Apple’s integrated development environment. It assumes you have some development experience and are familiar with the Cocoa API. It won’t teach you how to write code or much at all about Cocoa. There are other books for that. This one is strictly focused on how to use Xcode itself, whatever your development endeavors.
Of course, since Xcode is most often used with the Cocoa API and Objective-C, there are basic introductions to Cocoa concepts and a few trivial code samples sprinkled here and there to illustrate various points. In these cases, I point to the documentation that Apple provides (to save you some trouble looking it up), but I only had a limited number of pages in which to show you Xcode stuff, so please keep this in mind when writing your scathing Amazon reviews.
Also, I’ve formed the opinion that Apple is crafty when it comes to software releases. Not only are they ultra-secretive, but they appear to know my precise schedule and plans (I blame iCloud). They seem to use this knowledge to wait until I’m almost finished and then change a bunch of stuff in a single release, necessitating the tracking down and editing of many fine details. I imagine an Apple overseer watching me through my Mac’s camera, stroking a wrinkly, hairless cat and waiting until I’m almost finished. He then orders his henchmen to release the next set of random changes and leans toward the screen expectantly, muttering “Yeeesssss...” as I shake my fist at the sky and shout his name in dramatic fashion. The cat, of course, is hairless to avoid messing up his black turtleneck.
Whatever the case, I may say things that no longer apply to some future version or mention menus that no longer exist as such. Sorry. Blame Apple. Then buy my next edition.
What You Will Learn
This book is divided into three major parts and includes four appendixes on the book’s companion Web site.
Part I: The Basics: Getting Started with Xcode 4
In very short order, you’ll install Xcode and get down to business building a useless application. Nobody but perhaps your mother would buy it, but it very neatly demonstrates the Xcode 4 project workflow and how to find your way around a project.
Part II: Working with Cocoa Applications
Next, you’ll learn how to build and edit user interfaces, add resources, and customize the application. You’ll explore all major aspects of the Xcode user interface and its primary editors. You’ll learn to refactor code, to use the debugger and the Core Data modeler, and to archive builds for deployment (independently or via the App Store).
Part III: Going Beyond the Basics
Then you’ll dive a little deeper and explore Xcode’s build system (including the new schemes system). You’ll learn how to create and use libraries and frameworks and how to combine multiple projects into a single workspace. You’ll create and run unit tests and use custom scripts with the build process.
Finally, you’ll take a solid tour of Instruments (Apple’s profiling tool) and experience its uncanny ability to point out your mistakes and make you feel stupid. Thoroughly abashed, you’ll wrap up with an overview of Xcode’s integrated source code management support.
Appendixes
You’ll find four appendixes on the book’s companion Web site (http://xcodebook.com/extracontent). Appendix A helps you manage your iOS devices. Appendix B includes tables of gestures and keyboard shortcuts for frequently used tasks. Appendix C shows you how to manage Xcode documentation updates. Appendix D provides you with Apple and third-party resources for additional information.
Welcome to Xcode
Upstart newbies. Always strolling in and making short work of stuff that used to take you hours. In your day, you typed all your build commands and liked it. Uphill. Both ways. In the snow. Then again, why let those newbies outpace you? Xcode puts the same powerful tools you know (and some new ones you may not) in your hands. Despite its shiny, easy-to-use interface, a lot of power lurks just under the surface. Xcode 4 lets you write and manage your code, design and build user interfaces, analyze and debug your apps, and more. So what if it takes you less time?
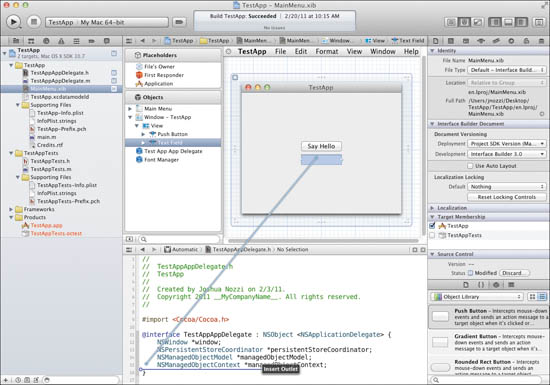
Interface Builder
Build and edit rich user interfaces with Interface Builder. Drag and drop outlets and actions directly into your code using the Assistant editor.
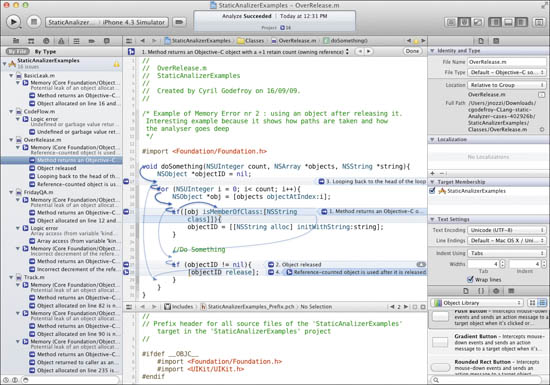
Clang Static Analyzer
Find subtle errors in your programs with the Clang Static Analyzer. Follow the blue arrows through your code as the problem is broken down step by step.
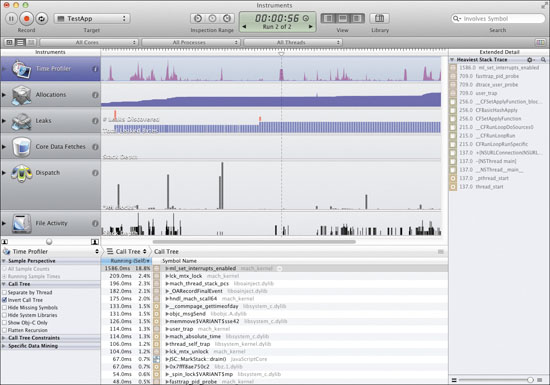
Instruments
Trace and profile your code with Instruments. Follow your application’s activity through time to find and analyze performance problems and more.
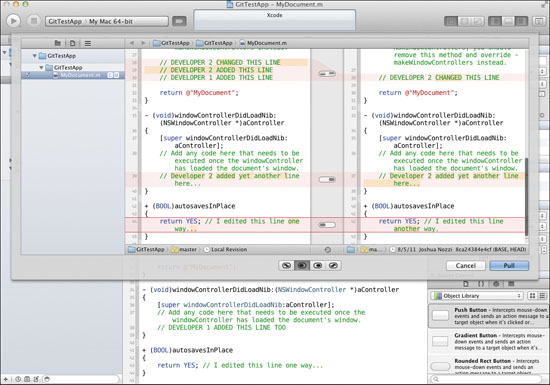
Source Code Management
Manage your source code with the integrated source code management features. Branch, merge, pull, push, and resolve conflicts all from within Xcode.
Part I: The Basics: Getting Started with Xcode 4
1. Discovering Xcode Tools
Xcode 4 is the flagship application of Xcode Tools, Apple’s suite of developer tools. It is aimed squarely at developing, testing, and packaging Mac OS and iOS applications, utilities, and plug-ins written with the Cocoa frameworks in Objective-C, though it’s perfectly suited for C/C++ development.
In this chapter, you’ll learn how to download and install Xcode Tools. You’ll also take a brief tour of some of the powerful tools that accompany Xcode.
Downloading
The latest stable release of Xcode 4 is obtained through the Mac App Store. To download the installer, launch the App Store application from your Applications folder and search the store for Xcode. Click Install and log in if requested.
As with any application purchased through the App Store, the installer (called “Install Xcode”) will appear on your dock with a progress bar tattooed on its icon. Go get some coffee because the installer is several gigabytes in size.
Installing
Once the download is complete, just launch the installer by clicking it in the Dock. If the Dock shortcut has gone away, you can find the installer in your Applications folder (again, it’s called “Install Xcode”). Just follow the on-screen instructions. The installer is very basic as the options you might know of from previous versions have gone away. Xcode 4 overwrites any existing versions in your system’s /Developer folder. This is the default (and now, unchangeable) install location for the Xcode Tools suite. Once the installation is complete, you’ll have a very powerful software development suite at your fingertips. Just look in the /Developer/Applications folder of your system disk. Xcode and its friends live there.
Note

The file you downloaded contains the tools and relevant SDKs. It does not contain the documentation for those SDKs, however. When you launch Xcode, it will check for the latest version of this documentation and download it in the background. These files are large as well. The processor, disk, and network activity this causes can be alarming, given that Xcode seems to be peacefully awaiting orders. You can turn off this automatic updating in the Documentation panel of Xcode’s preferences.
Exploring
Now that you’ve installed Xcode Tools, you can find it on your system disk under the /Developer folder unless you’ve chosen to install elsewhere. You’ll find Xcode and a number of other applications in the /Developer/Applications folder. Although this book concentrates on the Xcode 4 application, there are other important tools with which you should become familiar.
Let’s explore some of the tools included in the suite.
The Big Tools
There are three important applications in which you’ll spend most of your time.
Xcode
The Xcode integrated development environment (IDE) is the star of the suite. With Xcode, you create and manage projects, write and debug your code, design your UI, build your data models, write and run unit tests, and build and package your apps and plug-ins. You’ll spend most of your development time in Xcode. Some of these tools can be launched automatically from within Xcode (Instruments and the iOS Simulator, for example). This will be covered in later chapters.

Instruments
Instruments is Apple’s profiling and analysis tool. We’ll briefly visit Instruments in Part III, but this application could easily justify a book of its own. It could be loosely described as a luxury wrapper around DTrace (a performance measuring tool), but that would be understating its power. We’ll explore its most common uses for application development, which are profiling and memory management debugging.

iOS Simulator
Not all iOS developers can afford every iOS device on the market. Debugging an application directly on the device has some limitations as well. The iOS Simulator (previously named iPhone Simulator) provides a solution to both of these problems. We’ll explore the iOS Simulator in Chapter 17.

Other Helpful Tools
The following are some additional tools you are likely to use in a typical Mac or iOS project. These tools are also installed with the Xcode Tools suite.
Help Indexer
Mac OS users expect applications to come with the customary built-in manual, called a Help Book. This is a simple collection of HTML documents accompanied by a special—and required—index file for the OS X Help Viewer. The Help Indexer application processes your Help Book files and builds this index for you.

Icon Composer
Mac OS and iOS applications use the .icns format. The Icon Composer application allows you to drop your appropriately sized artwork into the image wells and test your icon against various backdrops.

PackageMaker
PackageMaker is used to build Mac OS Installer packages. The Installer packages let you tell OS X where to install your application and other resources, as well as run various pre- and post-flight scripts (scripts that are run before and after the main installation) with administrative privileges if desired.

Quartz Composer
Quartz Composer lets you create stunning visualizations for screen savers, interactive menu screens à la Front Row and Cover Flow, and more. The compositions can be self-contained or accept input from your application to affect various properties. Even non-developers can enjoy Quartz Composer, because it does not require writing a single line of code.

Wrapping Up
Plenty of other helpful utilities (both GUI and command-line) exist in addition to those covered here. Consult the Xcode user guide (found under Xcode’s Help menu) for details.
Note

In the Cocoa developer community, you’ll hear people refer to Interface Builder as a separate application. Prior to Xcode 4, Interface Builder was indeed a separate application. It is now integrated into Xcode.
2. Starting a Project
Xcode comes with a number of template projects to make it easier for developers to get started. Beyond templates for Mac OS and iOS applications, there are templates for command-line tools, AppleScript applications, frameworks, bundles, plug-ins, Spotlight plug-ins, IOKit drivers, and more.
In this chapter, you’ll create a basic Cocoa application, which you’ll use throughout this book to explore Xcode.
Welcome to Xcode!
You can find Xcode in the /Developer/Applications folder (assuming you chose this default location when you installed Xcode Tools). When you launch the application, you’ll be presented with the Welcome to Xcode window, as shown in Figure 2.1.
Figure 2.1 The Welcome to Xcode window
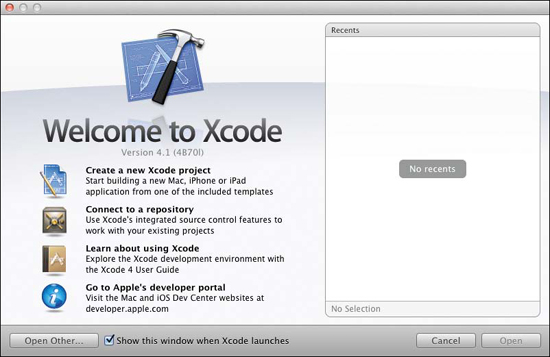
You can use this welcome window to start a new project, check out an existing project from a source code repository (such as Subversion or Git), open the documentation viewer, or visit Apple’s developer site. You can also ask Xcode not to show you this window on startup again.
Creating a New Project
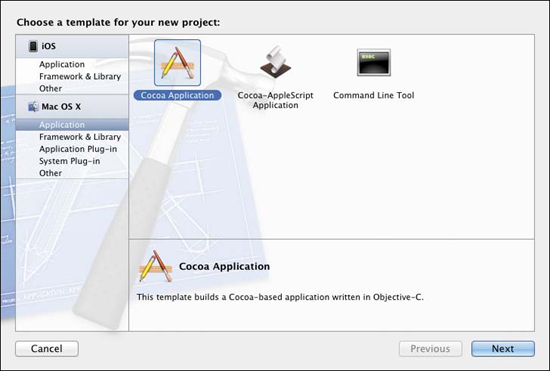
To create a new project, click the “Create a new Xcode project” option on the welcome screen. You can also choose File > New > New Project from the main menu at the top of the screen. You’ll be presented with a sheet from which you can choose a project template, as shown in Figure 2.2.
Figure 2.2 The New Project template sheet
Exploring the Templates
Let’s take a moment to look through the available project templates Xcode offers. The left panel separates the template categories by their types (such as Mac OS, iOS projects, and any third-party template types you may have installed). Beyond the obvious platform categorization, the templates are further subdivided by the type of product (application, plug-in, framework, and so on) you’ll be building.
In most cases, selecting an individual template yields an Options bar, allowing you to choose common subtypes (such as document-based versus non-document-based, static library versus dynamic, and so on) and optional subcomponents (such as Spotlight importers or Cocoa views for plug-ins).
Most projects will be Mac OS or iOS applications.
Creating a Test Project
Let’s create a test project with which to explore. To do this, choose the Application category under the Mac OS X type and then click the Cocoa Application template. Click Next to continue. Xcode will respond by asking you for some additional information to customize your project, as shown in Figure 2.3.
Figure 2.3 The New Project options sheet
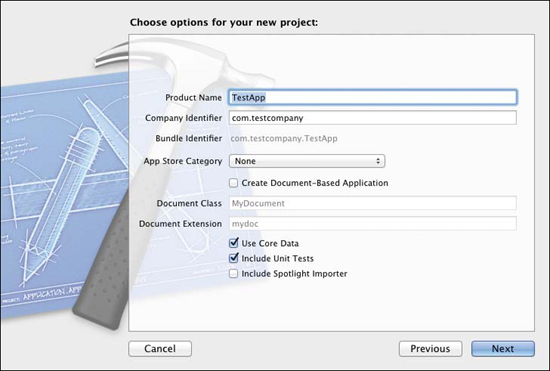
The Product Name field is where you would put your application’s name in most cases. Let’s call our product TestApp in the interest of clarity. This not only determines the name of your project file and its enclosing folder but the name of your built product (your application, plug-in, library, and so on).
The Company Identifier field is just as important as your product name. This identifier is used to create your bundle identifier. The bundle identifier, in turn, can be used as a unique identifier for your application’s preferences file, its document files, its associated Spotlight importer, and many other things. Apple encourages developers to use a reverse-ordered ICANN domain name. Assuming your domain is yourcompany.com, your company identifier would be com.yourcompany. Xcode fills in your app’s name (substituting illegal characters as needed) to form your project’s bundle identifier (displayed below the Company Identifier field).
Although only the Product Name field is required, you should always provide a suitable company identifier. The identifier doesn’t necessarily have to correspond to an existing domain, but it should be unique.
The App Store Category pop-up lets you select a general category under which your application would fall if you choose to deploy to the Mac App Store. Since you won’t be submitting TestApp to the App Store, you can leave that set to None, its default.
The next three options (Create Document-Based Application, Document Class, and Document Extension) let you use a document-based application template. A plain Cocoa application (Create Document-Based Application deselected) is intended for applications that do not work with individual files as documents; a document-based Cocoa application uses the Cocoa document architecture to open and manipulate document files. For simplicity, TestApp will not be document-based, so leave that option deselected.
The Use Core Data option adds support for Cocoa’s object graph management and persistence framework, called Core Data. Select this option so you can explore the Data Model Editor in Chapter 10.
The Include Unit Tests option will add support for unit tests to your project. Select this option to include unit tests, which you’ll explore in Chapter 18.
The Include Spotlight Importer option adds a Spotlight importer plug-in as a dependent build target to your project’s application target. When you add the necessary code, Spotlight—the Mac OS X search facility—will use the importer to add the data you provide to its search index automatically. Leave this deselected, and leave Spotlight importer plug-in programming for another book.
Different project and option choices can cause different fields to appear when creating a new project. Consult the Xcode documentation (covered in Chapter 4) for further details about these options.
Once you’ve filled in the requested information, click Next to continue. Xcode will present a Save As dialog box. Select the option to create a local Git repository for this project. You’ll explore Xcode’s Git (and Subversion) support in Chapter 21. Choose a convenient location (such as your desktop), and click Save.
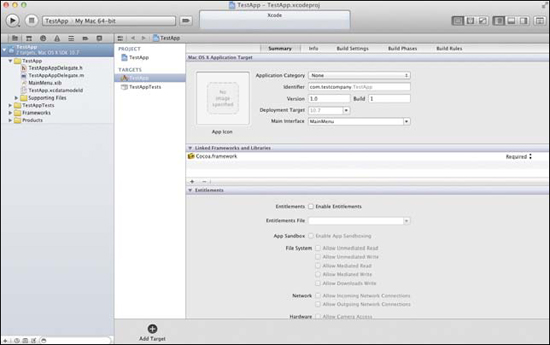
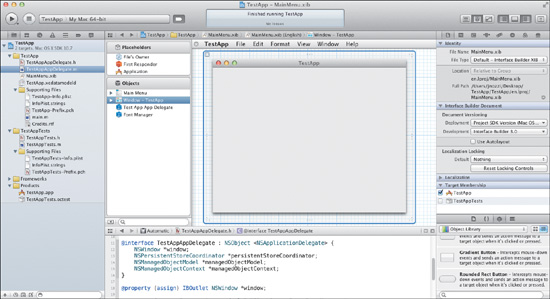
You should now have a basic Xcode project ready to go, as shown in Figure 2.4.
Figure 2.4 A newly created Cocoa application project window
Project Modernization
For those who weren’t born (as Mac or iOS developers) yesterday, Xcode introduces the concept of “project modernization.” As much fun as it is to create brand new projects full of new possibilities, many of us have existing projects that were created in earlier versions of Xcode.
These preexisting projects often contain settings that are not compatible with modern versions of Xcode. Fortunately, Xcode not only finds these problems but offers to fix them as well. It even lets you pick the fixes to apply, since its idea of “fixing” may not necessarily agree with yours.
Modernizing a Project
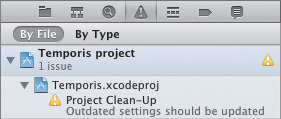
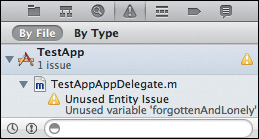
When opening projects that were created with previous versions of Xcode, you might notice some warnings appear in the Issue navigator (Figure 2.5), informing you of issues that need cleaning up.
Figure 2.5 Warnings of outdated project settings
Notes
Project modernization was introduced in Xcode version 4.1 and is not available in 4.0.
The Issue navigator is explored in Chapter 3.
Selecting the issue (or choosing Editor > Check for Outdated Settings from the main menu) will display a Build Settings sheet (Figure 2.6) summarizing the changes that Xcode thinks you should make. Deselect the check box to the left of any settings you think Xcode ought to ignore.
Figure 2.6 The Build Settings sheet prompting changes
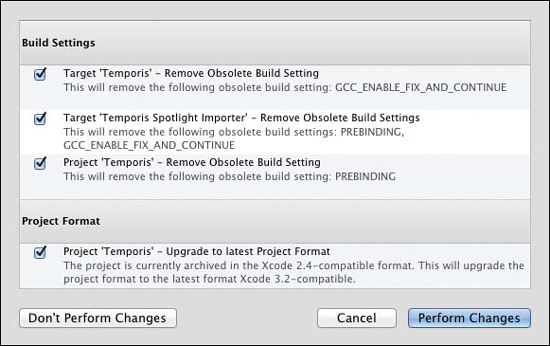
To perform the selected changes, click Perform Changes. To cancel without performing any changes, click Cancel. To ignore the selected issues, select Don’t Perform Changes. The separate Perform Changes and Don’t Perform Changes buttons let you accept some updates and then come back and instruct Xcode to ignore others.
Remember that you can always check for outdated settings at any time by choosing Editor > Check for Outdated Settings from the main menu.
Building and Running an Application
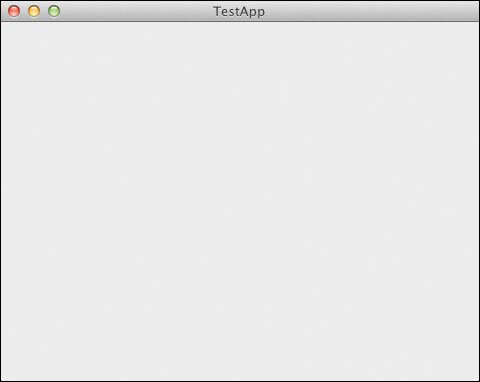
At this point you have a fully functional—if uninteresting—Cocoa application project that is ready to be built and run. To see your application, click the Run button in the project window toolbar (or choose Product > Run “TestApp” from the main menu). Xcode will build the project from scratch (because this is the first time it’s been built) and then launch it. After a short time, you’ll see your application’s empty window (Figure 2.7). It’s not particularly exciting at the moment, but it is a functioning application at this point, even without customization.

Figure 2.7 The new Cocoa application
The Run button doesn’t just trigger a build and run. You can click and hold the button to reveal a menu of other actions similar to those found under the Product menu. These actions include Test, Profile, and Analyze. Each of these will build the project automatically if it needs building before performing the requested action. These other actions are covered in later chapters.
Wrapping Up
TestApp isn’t very interesting in its current state, but it is a fully functional application with a main menu, a window, and even an About panel. You now know how to create, build, and run a basic template application. In the next chapter, you’ll explore Xcode’s user interface using the project you just created.
3. Navigating a Project
In the previous chapter, you created a Cocoa application project called TestApp. In this chapter, you’ll explore the anatomy of this project and familiarize yourself with Xcode’s user interface.
Earlier versions of Xcode allowed users to select a multiple-window interface, but the default was single-window (where most views related to the open project were contained within the same window). Single-window mode wasn’t quite single-window mode, however; a number of auxiliary windows could appear. In Xcode 4, Apple has taken the all-in-one-window design approach much further.
If it’s not open already, open the TestApp project you created in Chapter 2.
The Workspace Window
An Xcode project consists of a collection of source files (such as Objective-C files, Interface Builder nibs, and Core Data managed object models), resources (such as images and rich text files), and the Xcode project file, in which the various settings and build rules are maintained. It is helpful to think of an Xcode project as a collection of sources and resources with a project file to bind them together. Xcode 4 goes a step further and allows you to combine multiple related projects into a single workspace (see Chapter 16). The main window for a given project or workspace is called the workspace window (Figure 3.1).
Figure 3.1 The workspace window
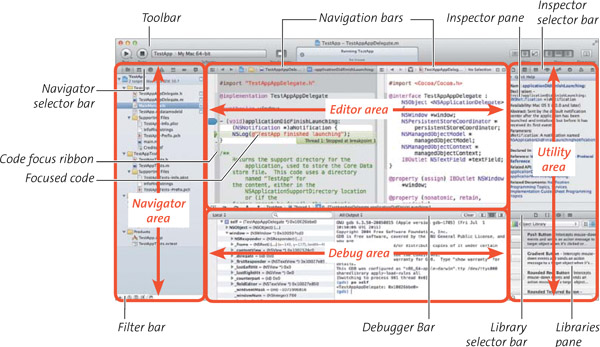
The workspace window is divided into multiple areas, which you’ll examine in detail in this chapter. Almost everything related to your workspace is contained within these areas, whose responsibilities include organization, navigation, editing, inspection, and debugging.
The Navigator Area
The Navigator area consists of a complex set of panes. Found along the left edge of the workspace window, it is the primary interface for organizing and exploring the files, symbols, build issues, run logs, breakpoints, threads and stacks, and search results for the project.
The button bar along the top edge of the Navigator area switches between the various navigation panes. You can toggle the Navigator area on and off using the View button bar in the toolbar near the right side of the workspace window.
Project Navigator
You can use the Project navigator (Figure 3.2) to find your way around the source and resource files of your project (or projects in the case of a multi-project workspace). Clicking any of the resources (except groups, which are merely logical containers within the project) causes Xcode to navigate to that resource, opening it in an appropriate editor in the Editor area immediately to the right of the Navigator area. You’ll explore various editors in Part II.

Figure 3.2 The Project navigator
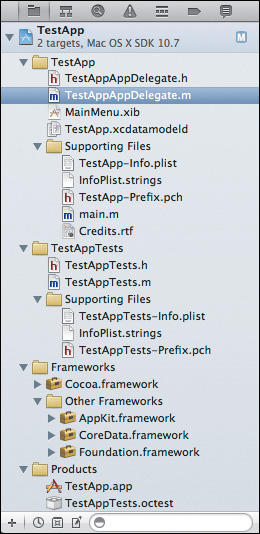
In addition, this area allows you to organize your project using groups (represented by yellow folders). You can create nested groups and move resources around just as you would with a file system. Groups can also represent real subfolders in your project folder. To create a group, choose File > New > New Group from the main menu.
The Project navigator works much the same way as the Mac OS X Finder in List view mode. You can add to, delete from, and reorganize resources in your project. In Chapter 6, you’ll explore adding files and resources to, and removing them from, a project. Later, in Chapter 21, you’ll explore Xcode’s source code management capabilities.
Symbol Navigator
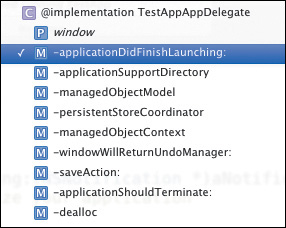
The Symbol navigator (Figure 3.3) gives you a somewhat different look at your project. Depending upon the filters you select in the filter bar (just above the list of symbols), you can jump to symbols defined within your project or within the Cocoa frameworks.

Figure 3.3 The Symbol navigator
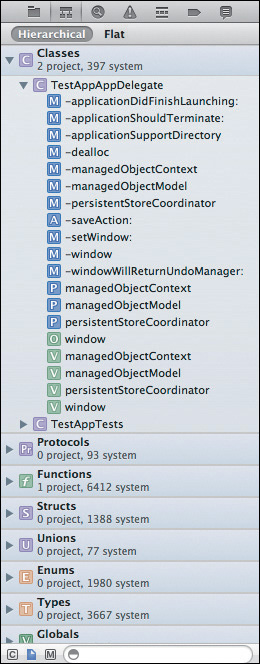
For example, rather than selecting a file from the Project navigator and then looking for your method or instance variable in the editor, you can type the symbol name in the search bar at the bottom of the Symbol navigator and then click the symbol in the list to jump directly to that symbol in your source.
The bar along the bottom edge of the Symbol navigator offers several list-filtering options. The first filter button (starting from the left) lets you choose whether the list shows all symbol types (whether symbols exist for those types or not) as opposed to only showing types for which symbols exist. The second button specifies whether all symbols are shown or only those belonging to the workspace. The third button specifies whether members of a given symbol are shown (for example, the methods of a class). The search field further filters the list by a given search term.
Search Navigator
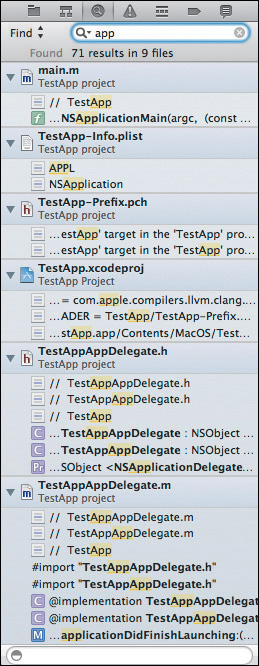
The Search navigator (Figure 3.4) allows you to search your entire project. The search field at the top of the pane searches the project, while the one at the bottom further filters the search results themselves. The results are arranged first by filename and then by matches within the file. Clicking a result opens the file and selects the match in the editor. Searching and replacing will be covered in more detail in Chapter 8.

Figure 3.4 The Search navigator
Issue Navigator
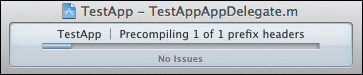
Upon building your project, the Issue navigator (Figure 3.5) lists any issues it finds. In Xcode, an issue can be an error or a warning. Like the Search navigator, the Issue navigator can organize the issues by the file in which the issues appear. Additionally, Xcode can show you issues organized by type. Clicking to select an issue will cause Xcode to navigate to the issue in the Editor area. Figure 3.5 shows Xcode reporting that the TestAppAppDelegate.m file has, like most people, some issues.

Figure 3.5 The Issue navigator
At the top of the Issue navigator are buttons that let you choose to show issues by the file in which they exist or by their type. The controls at the bottom of the navigator let you filter the list. The first button (starting from the left) lets you choose to show issues only from the last build. The second button lets you choose to show only errors (as opposed to warnings or static analyzer results). The search field lets you filter the list by a given search term.
Note
You can also jump from issue to issue using the arrows just above the scroll bar in the upper-right corner of the Editor area.
Debug Navigator
While execution is paused in an active debugging session (because of encountering a breakpoint or a crashed thread), the Debug navigator (Figure 3.6) allows you to navigate the threads and stacks of your application. You can organize the information by thread or by queue using the selector bar at the top of the navigator.

Figure 3.6 The Debug navigator
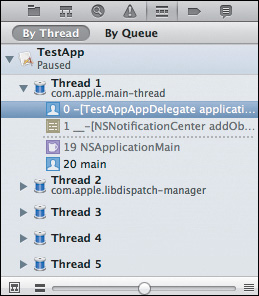
The controls along the bottom of the navigator control how much information the navigator displays. The button, when activated, causes the navigator to show only crashed threads or threads for which there are debugging symbols available (typically your own code). The slider controls the amount of stack information that is displayed. Sliding all the way to the right shows the full stack, while sliding to the left shows only the top frame.
The icons to the left of each stack frame indicate to whose code the frame belongs. For example, frames with a blue-and-white icon depicting a person’s head belong to your code, whereas purple-and-white icons depicting a mug belong to the Cocoa frameworks.
Breakpoint Navigator
All the breakpoints associated with your project are collected in the Breakpoint navigator (Figure 3.7). When you set breakpoints in the Source Editor (see Chapter 9), they appear in the Breakpoint navigator list, grouped by file.

Figure 3.7 The Breakpoint navigator
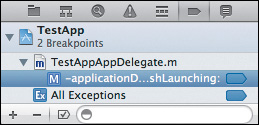
Clicking a breakpoint’s name navigates to its location in the editor. Clicking the blue breakpoint marker toggles the breakpoint on and off. Right-clicking a breakpoint and selecting Edit Breakpoint from the context menu pops up a detailed view that lets you set additional breakpoint properties (also covered in Chapter 9).
The controls along the bottom of the navigator allow you to add and remove breakpoints, as well as further filter the list. The Add (+) button pops up a menu when clicked, offering to add one of two non-workspace-specific breakpoints (to break on exceptions or at a named symbol you supply manually). The Remove (-) button removes any selected breakpoints. The next button to the right of the Remove button can filter the list to show only enabled breakpoints, while the search field can filter the breakpoints by a given search term.
Log Navigator
The Log navigator (Figure 3.8) collects all the various logs (including build, analyze, test, and debug). Clicking a log in the navigator displays it in the Editor area.

Figure 3.8 The Log navigator
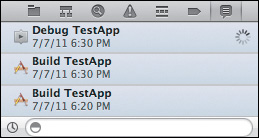
When selecting a debug log (also known as a run log), the contents of the Debug area’s console are displayed as plain text for you to browse. When selecting a build log, the Editor area displays a set of controls along the top edge, which let you filter the types of messages you want to see (including all messages, issues only, or errors only). Double-clicking a message navigates to the issue or file. Clicking the list icon at the right edge of a message will expand it to display its associated command and output.
The controls along the bottom of the navigator let you filter the list. The button lets you choose to show only the most recent logs of a given type. The search field lets you filter the list with a given search term.
The Jump Bar
The Jump Bar, found above the Editor area, shows you where you are in the organizational structure in your project (Figure 3.9). It additionally serves as a more compact version of the Project navigator. It is accessible even when the Navigator area is hidden and can be used to navigate your project by clicking any one of the segments and choosing a different path from the pop-up menu.
Figure 3.9 The Jump Bar, TestAppAppDelegate.m selected

The Jump Bar goes beyond the group and file level. It allows you to drill further down into the contents of the file. In the case of a source file, you can further select methods to jump around the file’s contents by clicking any segment after the file’s segment (Figure 3.10). With Interface Builder files, you can navigate the window and view hierarchy of your user interface.
Figure 3.10 The Jump Bar pop-up menu showing members of TestAppAppDelegate.m
The Jump Bar also appears in Assistant windows (covered later in this chapter) and can be used to select various behaviors in addition to individual files.
The Editor Area
The Editor area (Figure 3.11) dynamically switches between editors appropriate to the currently selected file (either through the Project navigator or through the Jump Bar). This means that, for source code files, you’ll see the Source Editor; for Interface Builder files you’ll see the Interface Editor, and so on. Among the other available editor types are the Data Model Editor, the Project Editor, the Version Editor, the Rich Text Editor, and more.
Figure 3.11 The Editor area showing the Source Editor
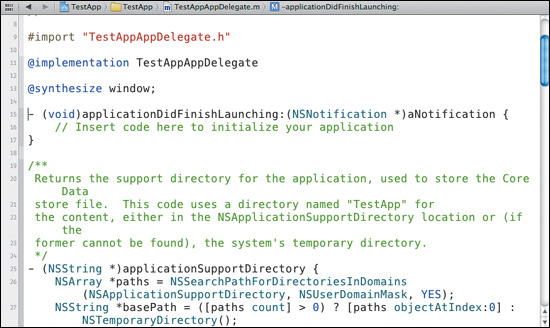
Although it is called the “Editor” area, this is something of a misnomer where some items are concerned. Some items are not editable, which means the Editor area serves more as a “Viewer” area. For example, the area might display an image resource (such as the application icon) when selected; however, there is currently no image-editing facility in Xcode 4, so you can only view the image.
The other major editors are covered in their related chapters throughout the book.
The Assistant
The Editor area conceals a deceptively powerful feature called the Assistant (Figure 3.12). The Assistant acts as a “split pane” editor with some added intelligence, depending on the behavioral mode you use. You can toggle the Assistant using the middle button of the Editor button bar that sits toward the right side of the toolbar area.

Figure 3.12 The Assistant
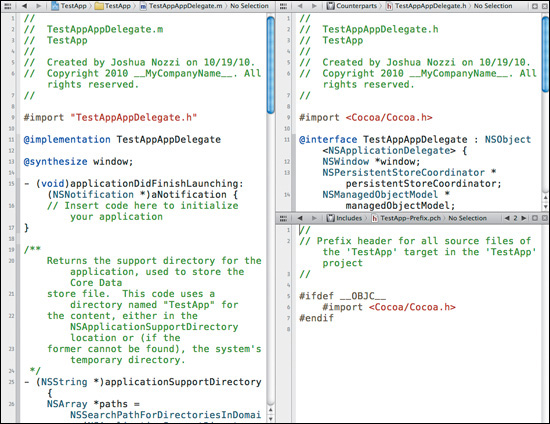
The Assistant is a very flexible contextual tool that helps you perform common tasks ancillary to the current editing context. For example, in the Data Model Editor, if you select a Core Data entity with a corresponding managed object subclass, the Assistant can display that subclass for reference or editing. If you select a xib to edit in Interface Builder, the Assistant can show the source file corresponding to the xib’s File’s Owner class (see Chapter 5) or can show the class of the object selected in the Dock to facilitate establishing action and outlet connections.
Opening Files in the Assistant
When you turn on the Assistant using the toolbar, it displays the selected source file’s counterpart in a single pane in Manual behavior mode (where you choose what is displayed in the Assistant pane yourself using its Jump Bar). You can use the Assistant’s Jump Bar to view or edit any file in your workspace. There will always be at least one Assistant pane visible while the Assistant is active.
Adding and Removing Assistant Panes
You can add or remove additional Assistant windows using the Add (+) and Remove (×) buttons in the upper-right corner of the existing Assistant pane (at the right edge of the panel’s Jump Bar).

To add a new pane, click the Add button on any existing pane. The new pane will have its own Jump Bar and will be added after the pane whose Add button you clicked. That is, if you clicked the Add button of the last pane, the new pane will appear after the last one; if you clicked Add for the first of several panes, the new pane will appear after the first one. To remove a pane, click the Remove button on the desired pane.
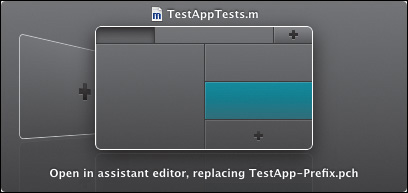
You can also open assistant panes using keyboard shortcuts. By default, holding down the Option key and clicking an item in the Project navigator will open the item in the Assistant when only one pane is present. If more than one pane is present or you perform an Option-Shift-click, Xcode asks you where you’d like to view the file with an intuitive destination chooser (Figure 3.13).
Figure 3.13 The destination chooser
Changing Layout Behavior
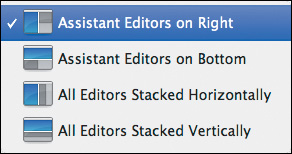
In the previous section, the phrase “after the pane whose Add button you clicked” is intentionally vague. This is because you can customize the Assistant’s layout behavior. To do so, choose View > Assistant Layout to see and select available layout modes (Figure 3.14).
Figure 3.14 The Assistant
Assistant Behavior Modes
You can change the Assistant’s behavior by clicking the segment of the Jump Bar immediately to the right of the navigation buttons. A menu appears (Figure 3.15) listing the available behaviors.
Figure 3.15 The Assistant’s behavior modes in the Jump Bar
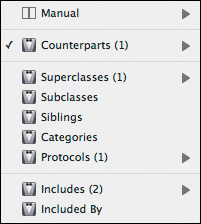
When in Manual mode, the Assistant behaves like a glorified—if neatly arranged—split pane editor. Its real power is in its automatic behavioral modes. When you choose any behavior other than Manual, the Assistant becomes contextually aware. Depending on the chosen behavior, the Assistant shows files related to the file (or a subselection within it) currently displayed in the main editor (the selection in the Project navigator).
The power of this feature becomes evident when you’re faced with a scenario where it’s necessary to edit a class’s implementation, header, and associated protocol, or when you select an object in Interface Builder’s Dock and need to add a new outlet or action while connecting it to the interface at the same time.
When there is more than one related file that the Assistant can display, additional controls appear to the left of the Add and Remove buttons. The controls include standard back and forward navigation buttons with the count of available associated files between them. These controls are not visible if there are fewer than two available associated files. The count is shown in the Jump Bar when selecting the behavior mode.
The term selection in this context means “the project member that is currently selected in the Project Navigator, shown in the main editor.”
The available modes are explored in their related chapters.
The Utility Area
The Utility area (Figure 3.16) provides supplementary information and controls for the current editor. Essentially anything you would expect to be in a floating palette for the editor can be found in the Utility area. To toggle the Utility area, click the right button in the View button bar in the toolbar.
Figure 3.16 The Utility area
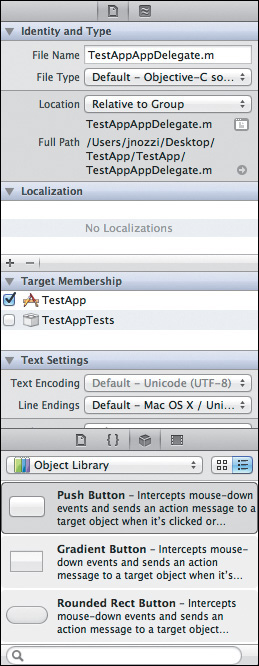
Like the Editor area and its Assistant, the Utility area is highly contextual. Additional buttons representing various inspectors appear along the top, depending on what you’re editing. For example, while editing a xib, buttons will appear for the Attributes inspector, Size inspector, Connection inspector, and more. With a data model selected, the Data Model inspector button appears. In most situations, two inspectors remain omnipresent: the File inspector and the Quick Help inspector.
The bottom panel contains the File Template library, the Code Snippet library (Chapter 7), the Object library (Chapter 5), and the Media library, which contains available template media (such as standard OS icons) as well as any media included in your workspace.
The Debug Area
The Debug area (Figure 3.17) appears by default when you run your application. You can also toggle it using the middle button of the View button bar in the toolbar.
Figure 3.17 The Debug area
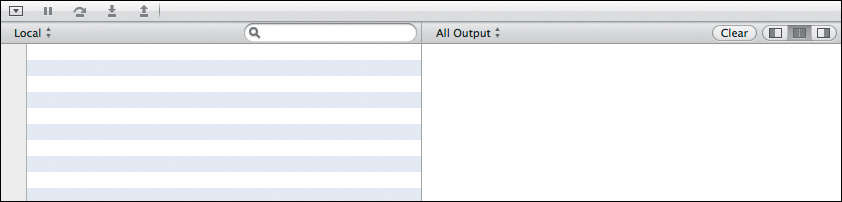
The Debug area is the primary interface for the debugger. It includes a control bar, a console, and a view for inspecting in-scope variables when paused. The Debug area and its controls are covered in more detail in Chapter 9.
Customizing Debugger Behavior
You can customize the Debug area’s behavior in Xcode’s preferences, on the Behaviors tab. There you can choose what actions the debugger takes when certain events occur (including run, pause, unexpected quits, successful quits, and so on).
For example, you could choose to show the Debug navigator when debugging starts or pauses. You could also choose to show the Project navigator and close the Debug area when the application quits normally. If the application quits unexpectedly, you could choose to show the Log navigator, navigate to the most recent run log, and play an alert sound to draw attention to the problem. Custom behaviors are covered in more detail in Chapter 16.
The Activity Viewer
The Activity Viewer (Figure 3.18) isn’t overly complicated and offers little interaction, but its prominent (and immutable) placement in the center of the toolbar makes it worth mentioning. It provides you with visual feedback of all the activities Xcode is performing on the workspace.
Figure 3.18 The Activity Viewer
When more than one activity is underway, the Activity Viewer alternates between them like an ad banner and displays the number of concurrent tasks on its left side. You can click the number to display a pop-up, which lists all the current activities and their progress individually.
In previous versions of Xcode, the right side of each window’s bottom edge had its own status field showing the same information (mostly related to build and debug status). Xcode 4’s all-in-one approach makes it easier to have a single place to see the current status of any actions Xcode is performing.
If there are any issues (errors, warnings, and so on), the number of issues will be displayed in the Activity Viewer as well. Clicking the issue counter will switch to the Issue navigator so you can find and review the issues.
The Tabs
Another new feature in Xcode 4 is the introduction of tabs. Similar to the Safari browser, you can create tabs within the same workspace window for various project members in the workspace. For example, Figure 3.19 shows a source file open in one tab and a user interface file open (in the Interface Editor) in another.
Figure 3.19 Two tabs showing TestAppAppDelegate.m and MainMenu.xib

To create a new tab, choose File > New > New Tab from the main menu. Click any tab to switch to it and navigate to the project member you’d like the tab to represent. You can reorder tabs by dragging and dropping. To rename a tab, double-click the title, type a new name, and then press Return. To close a tab, click the X icon that appears when you mouse over the tab or choose File > Close Tab from the main menu.
Tip

Keyboard shortcuts are handy ways to speed up tab use. Pressing Command+T creates a new tab, while Command+W closes the currently selected tab. Press Command+} and Command+{ to switch between the next and previous tabs.
The Organizer Window
The Organizer window (Figure 3.20) stands apart from workspace windows as a collection point for project and device management, including repositories, archives, snapshots, and more. The various aspects of the Organizer will be explored throughout the book. To open the Organizer, choose Window > Organizer from the main menu.
Figure 3.20 The Organizer window
Wrapping Up
This chapter gave you a taste of the most obvious user interface elements in the workspace window. You’ll explore more of the user interface in later chapters, but there’s far more to Xcode than can fit in a book this size. In the next chapter, you’ll learn how to use Xcode’s built-in documentation browser and help facilities to get help with your coding and with using Xcode itself.
4. Getting Help
You can get help in Xcode 4 for the IDE as well as the Cocoa frameworks in a number of ways. In this chapter, you’ll learn how to find the answers you need.
The Help Menu
You’ll start with the most obvious place first. If you’re familiar with Mac OS X, you should be familiar with the Help menu. Starting with Mac OS X 10.5, the Help menu (Figure 4.1) features a standard Search field, which shows you not only help topics but main menu items that match your search term.
Figure 4.1 The Xcode Help menu
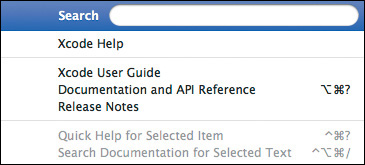
Beneath the Search field are menu choices to open some of the more important help libraries with which you should familiarize yourself. A link to Xcode’s release notes is also listed there. Most of these will open the Organizer window, which you saw in Chapter 3.
Xcode Help
The Xcode User Guide menu item opens a splash page containing video and links about how to find help in Xcode.
Xcode User Guide
The Xcode Help menu item opens the user manual for Xcode. Inside you’ll find in-depth explanations and how-to instructions for all Xcode features.
Documentation and API Reference
The Documentation and API Reference menu item simply opens the Organizer window in Documentation mode so you can browse or search the installed documentation libraries. It will remain on the currently selected page without navigating away and simply show the window.
The Rest
The remaining menu items trigger quick help for the currently selected code in the active workspace window, and open the Organizer window in Documentation mode with the text input cursor in the search bar, respectively.
The Organizer’s Documentation Tab
The Documentation section of the Organizer is Xcode’s main viewer for all SDK and developer tools documentation. Open the Organizer by choosing Window > Organizer from the main menu, and then choose the Documentation tab in the toolbar (Figure 4.2).
Figure 4.2 The Organizer’s Documentation tab
The Organizer responds by showing you a pane on the left (similar to Xcode’s Navigator area) and a main viewing area. Along the top of the main viewing area, you’ll see a Jump Bar similar to the one you explored in Chapter 3. This Jump Bar, however, allows you to navigate the documentation as opposed to your project. The Organizer’s navigation area has three modes: Explore, Search, and Bookmarks. The button bar at the top of the pane switches between the modes.
Explore
In Explore mode, an outline of each of the documentation sets and their sections displays. You can drill down by topic through the guides and API reference documents.

Search
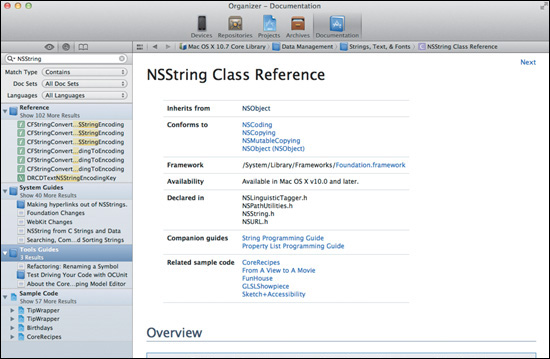
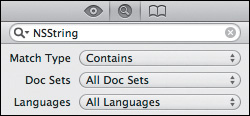
In Search mode, a search field appears, allowing you to search all installed documentation sets. Clicking the magnifying glass icon, then choosing Show Find Options from the context menu reveals a set of filtering options (Figure 4.3) that let you ignore unwanted libraries and more. The results are grouped by type (such as Reference, System Guides, Sample Code, and so on).
Figure 4.3 The Organizer’s search options panel
Bookmarks
In Bookmarks mode, you can jump directly to documentation pages you’ve bookmarked. You can set bookmarks by choosing Editor > Bookmarks from the main menu or by right-clicking anywhere in the page and choosing Add Bookmark for Current Page from the context menu. To delete a bookmark, select it and press the Delete key.

The Source Editor
Although you’ll explore the depths of the Source Editor in Part II, there are a couple of useful ways to find contextual help from within your code.
Quick Help in the Utility Area
As you saw in Chapter 3, Xcode’s Utility area gives you access to various properties, code snippets, user interface elements for Interface Builder, and Quick Help. The Quick Help utility continuously updates its content depending on what you’ve selected in the Source Editor.

To get a feel for this utility, make sure your TestApp project is open and then select the TestAppAppDelegate.m source file from the Classes group in the Project navigator. Open the Utility area, and select the Quick Help utility. In the Source Editor, click window in the @synthesize window; statement. Quick Help responds by showing you the name of the symbol (window) and the header file in which it is declared (the TestApp project’s TestAppAppDelegate.h file).
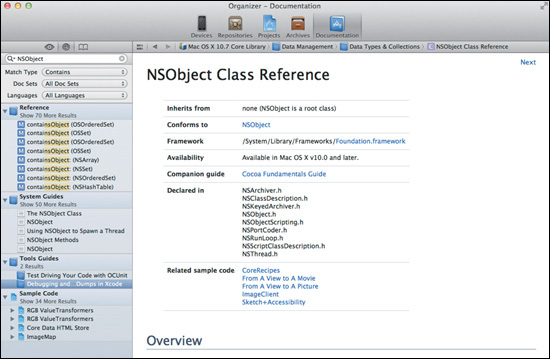
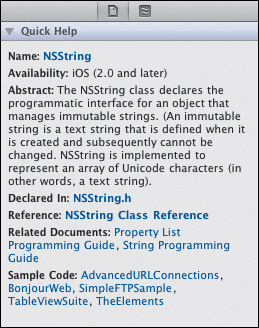
For a more interesting example, scroll down a bit until you find the – (NSString *) applicationSupportDirectory method, and click the NSString symbol. Quick Help responds by showing a much more detailed description of the NSString class (Figure 4.4), which is part of the Cocoa frameworks and is documented by the built-in document libraries. Any text highlighted in blue is a hyperlink to the corresponding documentation. Clicking a Quick Help hyperlink opens the linked information in the Documentation section of the Organizer.
Figure 4.4 The Quick Help utility
Search Documentation for Selected Text
Another handy way to find the documentation for symbols such as NSString is to select the symbol in the Source Editor and then choose Help > Search Documentation for Selected Text from the main menu. As with hyperlinks in the Quick Help pane, choosing this option will open any corresponding documentation it finds in the Documentation section of the Organizer.
Tip

It’s not necessary to open the Utility pane to see Quick Help content. The same information will appear in a pop-up bubble by holding down the Option key and clicking the symbol you want to locate.
Community Help and Feedback
There are a number of community Web sites for finding more help than is available in the documentation, including Apple’s own developer forums. See Appendix D for more information.
Apple’s Developer Forums
Apple’s developer forums are accessible to ADC members (http://devforums.apple.com). There you can receive help and advice from the Cocoa developer community as well as the occasional Apple engineer. Because this is a public forum, it’s important to keep in mind that most people there are developers like you and are volunteering their time. Take extra care to search for similar questions before posting, ask detailed and clearly written questions, and be civil. As with any community, anything less than civility and courtesy will make the community less likely to help you in the future.
Documentation Errors
If there is anything about Apple’s documentation that is unclear, incorrect, or lacking in any way in Xcode, you are encouraged to submit feedback to Apple. At the bottom of every page of the documentation are hyperlinks that allow you to submit feedback—good, sort-of-good, and bad—to the Apple documentation team. Constructive, detailed feedback helps Apple provide better documentation, and improvements are released often.
Wrapping Up
Xcode offers many ways to find help. Most of those ways point to the same documentation set, but even the documentation pages help you submit suggestions for improvement. In addition, you will find a number of community Web sites (one of which is Apple-hosted) and blogs a quick Google search away. Even if the built-in documentation doesn’t help, the chances are quite good you’ll find your answer on the World Wide Web.
You should now have your bearings in the Xcode IDE. In Part II, you’ll use Xcode to expand on the TestApp project by adding some user interface elements, writing some code, defining a data model, and more. From there, you’ll delve into the debugger and building the application for deployment.
Part II: Working with Cocoa Applications
5. Creating User Interfaces
In previous versions of Xcode Tools, Interface Builder was a separate application. In this chapter, you’ll learn how to use Xcode 4’s newly integrated user interface tools.
The contents of this chapter require some familiarity with Cocoa development, which is beyond the scope of this book. Basic background is given where necessary; however, you are encouraged to read the Cocoa Fundamentals Guide provided by Apple to understand the design concepts behind user interfaces in Cocoa applications.
Understanding Nibs
Cocoa applications load their graphic user interfaces from Interface Builder files (called nibs, or xibs if using XML format, which is the new default). The files are essentially “freeze-dried” object graphs representing the user interface you’ve constructed and the connections between the UI elements and one or more controller objects. Several key concepts are important to grasp when designing and working with a Mac OS or iOS application.
File’s Owner and Controller Objects
A nib and its content always have an owner. Whether it’s an instance of NSWindowController, NSViewController, NSDocument, or any other object, the owner serves as the top-level object that serves as the primary point to which to wire the user interface elements found in the nib.
Generally speaking, File’s Owner is intended to be a controller object (or, in the case of NSDocument, a model-controller). There can be and often are multiple controller objects within a single nib, any of which can provide outlets or actions.
Actions and Outlets
Two types of connections exist between your code and a nib’s contents: actions and outlets. Both types of connection are established by drag and drop.
An action is a method that is called by a control. That is, depending on the type of control, some form of user input has triggered the control to perform its function. In the case of a button, a mouse click would trigger the button’s action. Any given control’s action requires two elements: the action itself and a target. Actions are defined in source code as follows:
- (IBAction)performSomeAction:(id)sender;
- (IBAction)performSomeOtherAction:(id)sender;
Note
The file extension .nib stands for NextStep Interface Builder, which is a holdover from the original creators of these tools—Next, Inc. The newer file extension .xib stands for XML Interface Builder.
An outlet is an instance variable of an object (typically a controller or view object) that serves as a pointer to an element in a nib. Outlets are used to communicate with these objects. An example would be an outlet named tableView that points to an NSTableView instance that exists within a nib. The outlet could be used to ask the table view to refresh after some change to its underlying contents. Outlets are defined in source code as instance variables of a controller as follows:
IBOutlet NSTextField * titleField;
IBOutlet NSTableView * userListTable;
Compartmentalization
It’s common for an application to have multiple xib files that contain portions of the UI. In all but the simplest applications, there are usually some parts of the application that the user won’t access in every session, so it’s not necessary to load every part of the UI every time the application is executed. Loading only those portions of the UI that are needed can make the application more responsive and can give it a smaller memory footprint.
An example of this would be the preferences window of a Mac OS application or the user account view of an iOS application. These are user interface elements that should be kept in their own separate nibs and their associated controllers only created as needed.
The first advantage of this approach is performance. Your application will save memory by loading only the parts of the interface the user needs when they need it, which is a necessity on an iOS device. Since your application is creating controllers and their associated UI on demand, it takes less time to launch the application and reach a ready state for the user.
The second advantage is maintainability for the developer. By separating the user interface into distinct areas of responsibility (the preferences, the user login window, the export sheet, the map view), your application’s architecture is clearer and more easily managed and navigable.
Note
The details of the target/action mechanism and its various forms are beyond the scope of this book. Consult the Cocoa Fundamentals Guide in Apple’s Cocoa documentation (found in Xcode’s documentation browser or on the ADC Web site) for more information.
Getting Familiar with Interface Builder
The Interface Builder tools in Xcode 4 consist of the Editor, the Utility area (which includes a library of user interface elements and inspectors with which to configure them), and the Assistant for defining actions and outlets. Figure 5.1 shows a project nib ready to edit in the Interface Builder Editor. The Assistant, whose role in the Interface Builder Editor we’ll explore later in this chapter, is also shown in Figure 5.1.
Figure 5.1 Interface Builder showing a nib
The Editor Area
The Editor area (Figure 5.2) is where you construct the interface. This involves dragging interface elements from the Utility area’s object library into the canvas (the grid area) of the Editor and sizing and positioning them as needed. You can also create interface elements and controller objects by dragging them into the Dock, immediately to the left of the canvas.
Figure 5.2 The Interface Builder Editor area
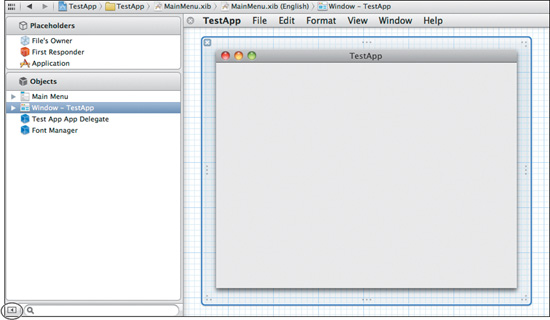
The dock bar along the left side of the Editor (to the left of the grid) in Figure 5.2 is expanded to show more detail about the objects contained in the xib. Use the button at the bottom of the dock to expand or collapse the dock.

Only user interface elements (such as buttons and windows) can be dragged into the canvas. Instances of controllers aren’t part of the user interface but are created or represented in the nib to serve as a connection point between the UI and your code; therefore, they exist only in the Dock.
You can make connections to outlets by holding down the Control key and dragging from the controller in which the outlet is defined to the desired interface element. The controller could be File’s Owner (the controller to which the contents of the nib belong) or some other controller object that you’ve instantiated in your nib.
You can make connections to actions by holding down the Control key and dragging from the interface element to the controller that defines the desired action. For example, a button could be connected to a Create User action. More than one user interface element (such as a menu item) can be connected to a given action. The sender of the action is always passed along to the action, allowing you to respond differently depending on the sender or to query the sender for its state, such as whether a check box is selected or deselected.
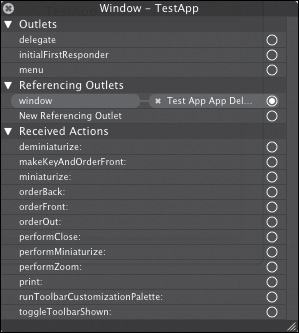
Right-clicking an object in the Editor displays a semitransparent window that contains a list of the object’s outlets, the outlets of other objects that reference it, and actions the object can receive (Figure 5.3). Connections can be formed from this window by dragging a connection from the circle that is to the right of a given outlet or action to the target. To disconnect an outlet or action, click the X in the middle of the connection.
Figure 5.3 The connections window
The Jump Bar follows the same hierarchy as the windows and views in the nib and represents the currently selected object. For example, the selected object could be a button within a tab view within a window within the nib.
The Utility Area
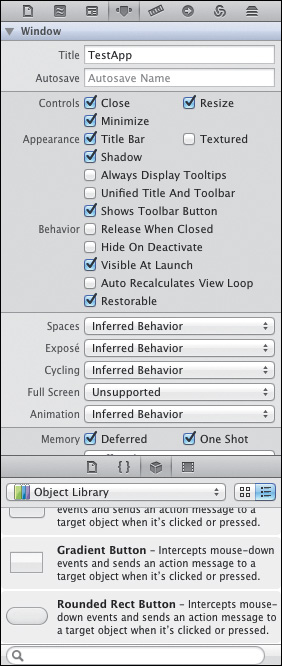
When a nib is selected in the navigator, the Utility area (Figure 5.4) adds additional inspectors to the File and Quick Help panes, such as the control’s style, auto-sizing settings, and animation settings. Select any element or controller object in the canvas or the Dock to view or adjust its properties using the inspectors.
Figure 5.4 The Utility area showing available Interface Builder inspectors
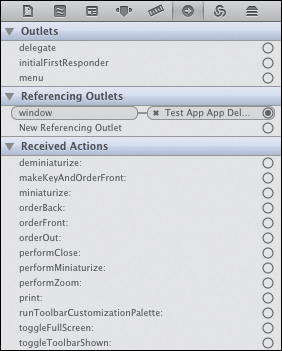
Connections can also be formed with the Utility area, using the Connections inspector (Figure 5.5). This inspector is similar to the window that appears when right-clicking an object in the Editor, and it behaves in the same way.
Figure 5.5 The Connections inspector
Below the inspectors is the Libraries pane mentioned in Chapter 3. The Object library (Figure 5.6) contains a list of standard Cocoa objects as well as objects belonging to other frameworks and code libraries (such as QTKit or WebKit).
Figure 5.6 The Interface Builder Object library
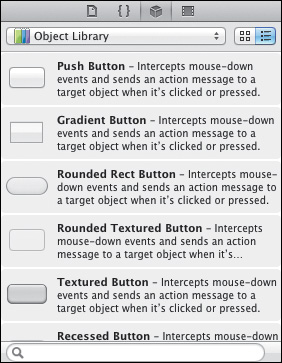
The pop-up at the top filters the list by library while the search field at the bottom filters by search term. Hovering the mouse pointer over an object provides a description of the object if one exists. Drag an object from the library to the canvas or the Dock to add it to the nib (or to a specific view or window). You can also double-click an object to add it.
The Assistant
As you learned in Chapter 3, the Assistant acts as a secondary editor that can display “counterparts” to the selected project member. In the case of a nib, the counterpart is the interface (usually in a separate header file) of the class represented by the File’s Owner placeholder or that of a selected controller object.
Using the Assistant with Interface Builder goes a step beyond simply allowing you to add outlets and actions by typing them yourself. You can add actions and outlets by dragging a connection from a control directly into class interface source code in the Assistant area. Xcode responds by inserting the appropriate source code for the action or outlet.
Available Assistant Behaviors
Automatic behavior shows the files Xcode considers to be the best choice for the selected item or view in the xib.
Top Level Objects behavior shows the objects at the “top” of the xib’s object hierarchy. This can include the windows and views as well as any instantiated objects (such as custom classes and ready-made object controllers).
Sent Actions behavior shows any files containing actions called by the selected item.
Outlets and Referencing Outlets behaviors show any files containing outlets for the selected item or referenced by its outlets.
Class behavior shows any file containing the class of the selected item.
Adding User Interface Elements
Now that you’re familiar with Interface Builder, you’re ready to add some actions and outlets to TestApp. You’ll start by adding a button that displays the traditional “Hello World” in a dialog box. You’ll then add a text field with corresponding outlet in which to display the greeting.
To prepare, locate and select the MainMenu.nib file in the Project navigator. Click the window icon in the Dock to open the application’s main window in the canvas. Click the Assistant button so the Assistant area is visible, and make sure the Assistant is showing the TestAppAppDelegate.h file (the interface for the class represented by the File’s Owner placeholder of this nib). The project window should look similar to Figure 5.1.
Adding an Action Button
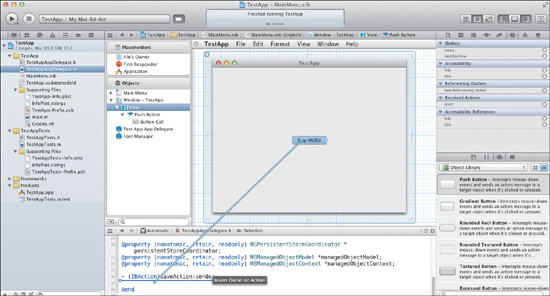
To add the Hello World action, you’ll need a button. Find the Push Button control in the Object library, and drag it into the window. Double-click the button, set its title to Say Hello, and then press Return. Control-drag a connection from the button to the source code in the Assistant. For best results, place the action after the – (IBAction)saveAction:sender; line and before the @end directive, as in Figure 5.7.
Figure 5.7 Dragging a connection into the Assistant
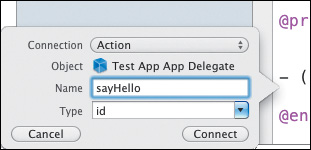
A pop-up will appear (Figure 5.8). Make sure the Action connection type is selected, and then type sayHello in the Name field. The method name is actually sayHello: (with a colon), but Xcode will add this for you automatically. Press Return or click Connect to add the action.
Figure 5.8 The connection creator pop-up window
You’ll need to add some code to make the action do something interesting. Navigate to the TestAppAppDelegate.m file (the implementation file for the TestAppAppDelegate class), and scroll down to find the - sayHello: method. Edit it to look like the following:
- (IBAction)sayHello:(id)sender {
[[NSAlert alertWithMessageText:@"Important Message"
defaultButton:@"Hello Yourself"
alternateButton:nil
otherButton:nil
informativeTextWithFormat:@"Hello World"] runModal];
}
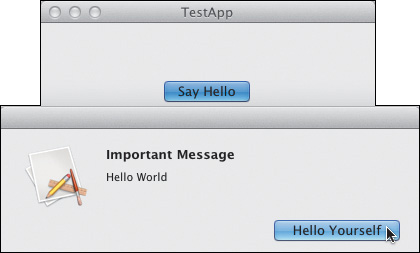
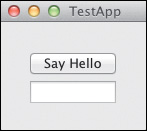
Click the Run button to build and run the application. Give your Say Hello button a test click to make sure it’s working. You should see something similar to Figure 5.9. When you’re satisfied, quit the application and navigate back to the MainMenu.nib file.
Figure 5.9 TestApp displaying its Hello World dialog box
Adding a Text Field
Perhaps you believe modal dialog boxes are overused, so you’ll want to put that text into a text field in the application’s window. Find the Text Field control in the Object library, and drag it into your window. To communicate with the text field and set its string value to Hello World, you’ll need to create an outlet for it.
To add the outlet, drag a connection from the text field to the source code in the Assistant. This time, place the connection within the curly braces (because outlets are instance variables of a class). Choose the Outlet connection type, name it textField, and then press Return to finish adding the outlet.
Now that your code has a reference to the text field, you can change the action to display the message there rather than in a modal dialog box. Navigate back to the –sayHello: action in the TestAppAppDelegate.m file, and change it to look like the following:
- (IBAction)sayHello:(id)sender {
[textField setStringValue:@"Hello World"];
}
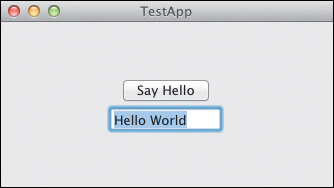
Build and run the application, and verify everything is working. Your application should look something like Figure 5.10.
Figure 5.10 TestApp showing its Hello World message in a text field
Layout
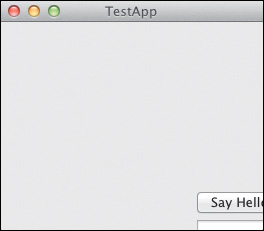
You’ve learned the basics of creating and wiring up a simple user interface. There’s one small problem, however. Run TestApp again if it isn’t running already, and try resizing the window. The controls stubbornly stay where they are, refusing to do something smart (Figure 5.11).
Figure 5.11 Improperly behaving layout
There are, as of the release of Mac OS X 10.7 Lion, two mechanisms through which you can define the sizing and positioning behavior of views: the original “springs and struts” and the new Autolayout feature.
Note
Each of the two layout mechanisms has a well-defined API that allows you to use code to control layout behavior. Because this book focuses on Xcode and not Cocoa development, the coding topic will not be covered.
Using Springs and Struts
The “springs and struts” concept has been around since the earliest days of Cocoa. It’s not without its frustrations, but for iOS and pre-Mac OS X 10.7 applications, it still reigns.
The concept is simple: Views (custom views, tables, buttons, and so on) are contained within a “superview” and may be resized or moved around if the superview is resized. Springs dictate whether the view will be stretched or compressed vertically and horizontally relative to the superview. Struts dictate whether the left, right, top, and bottom edges of the view maintain a certain distance from the bounds of the superview or are free to float around.
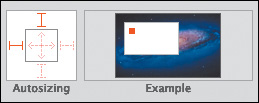
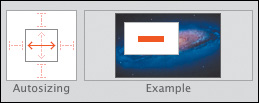
Figure 5.12 shows the Autosizing control, found in the Utility area under the Size Inspector panel. The Say Hello button is selected in this case. The springs are shown in the inner box (the vertical and horizontal red lines with arrows on their ends); the struts are the outer red lines. The selected (active) springs and struts are a solid, brighter red; the inactive ones are lightly shaded. Clicking any spring or strut will toggle it active or inactive. The Example control, on the right, animates and shows how the view (the red rectangle) would behave relative to its superview (the enclosing white rectangle).
Figure 5.12 The Autosizing control
What’s Wrong?
Note the settings for the Say Hello button. Only the top and left struts are active, indicating that the button will maintain the same distance on its top and left edges from the bounds of its superview (the window’s content view) and will not resize vertically or horizontally. This is exactly the case in Figure 5.11; the button (and the text field below it) will remain stubbornly stationary even when the window is too small to show it.
Positioning
In this case, the fix may seem simple. For both the button and the text field, none of the springs or struts should be active. This means they won’t resize, and they’ll float freely within the superview as it’s resized (in response to the window being resized). Because both controls are more or less in the middle of the window, they will (more or less) stay that way as the window is resized.
Figure 5.13 shows the Autosizing control with all springs and struts deactivated. Note that the Example view shows the view (the red rectangle) remaining centered in the superview (the white rectangle). Do this for both the button and the text field. Select each view, one at a time, and click the top and left struts in the Autosizing control to turn them off.
Figure 5.13 Springs and struts deactivated in the Autosizing control

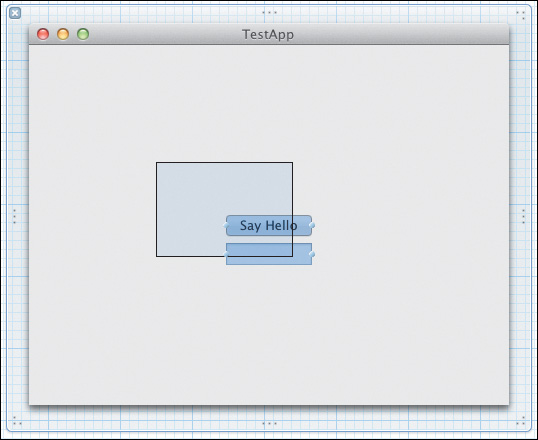
Figure 5.14 shows that a problem remains. Although the button and the text field are “more or less” centered, they’re moving relative to one another as well, which causes them to overlap (and when the window is made larger, they move farther apart). A common trick for controls you want to group together is to enclose them in a box (which has a nice bounding line to group its contents visually) or a plain custom view (which is invisible).
Figure 5.14 Overlapping controls
To employ this trick, drag a selection around the button and text view to select both at the same time (Figure 5.15). Choose Editor > Embed > Custom View from the main menu. The controls are now subviews of a new custom view, which is, in turn, a subview of the window’s content view. The custom view is selected. Now deselect, as in Figure 5.13, all springs and struts in the Autosizing control so the custom view floats freely. Since the custom view won’t be resized, its subviews (the button and the text field) won’t move at all.
Figure 5.15 Selecting multiple controls
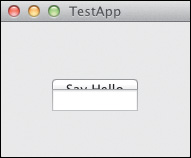
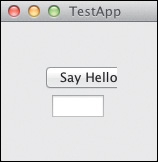
Run TestApp and play with the window size once again. Figure 5.16 shows that the controls now maintain the same distance from one another and remain properly centered.
Figure 5.16 Centered controls
Sizing
For the sake of brevity, we’ll skip an exhaustive exploration of each possible combination of the settings. However, you’ll need the basics of the spring behavior. Say your goal is to make the button and the text field grow and shrink horizontally as the window is resized, but you still want to maintain the grouping of the two.
Because there is now a hierarchy several levels deep (the window’s content view contains the custom view, which contains the button and the text field), you must consider the sizing behavior of more than just the text field. For example, if you only set the text field to size horizontally in response to its superview being resized, nothing will happen. This is because the custom view is not set to autosize horizontally.
You’ll have to enable the horizontal spring for both the text field and the custom view. Figure 5.17 shows the Autosizing control with only the horizontal spring enabled. Do this for both the text field and the custom view. Interface Builder respects the autosizing behavior even when resizing views in the editor. Select the custom view, if it’s not already selected, and make it wider using the resize grips on its sides. Notice how the text field has also grown wider, while the button has stayed the same width and has remained centered within the view. Recenter it in the window so it looks nice.
Figure 5.17 Autosizing control set to size horizontally
Constraints
Run TestApp once again and play with the window size. Notice how the text field now grows and shrinks. And notice that if the window gets too small, the button is cut off and the field gets a little too narrow (Figure 5.18). This is a limitation of the springs and struts model: The only way to apply any kind of constraints is by setting a minimum size so things don’t get smooshed together or cut off.
Figure 5.18 Cut-off controls in a small window
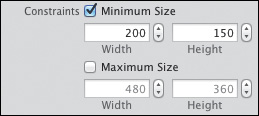
The simplest fix is to set a minimum window size. Select the window, and in the Constraints section of the Size inspector, select the Minimum Size check box and set a reasonable minimum size (such as 200 by 150), as shown in Figure 5.19.
Figure 5.19 Setting window size constraints
Now when you run TestApp and play with the sizing, the controls should more or less behave themselves. You may need to play with the minimum window size or the sizes of the text field and enclosing custom view to get it right.
Using Autolayout in Lion
As mentioned, Lion (Mac OS X 10.7) introduces a new layout mechanism called Autolayout. Although it certainly has vast improvements over springs and struts (and a nifty layout language all its own for use in code), its use is not compulsory on Lion or above. That is, the springs and struts mechanism will still work as it always has. In fact, you must turn on Autolayout for each Interface Builder document in which you intend to use it, otherwise springs and struts still rule. Correspondingly, Autolayout can only be used with applications that target OS X 10.7 and above.
Note
You’ll need to be running Xcode version 4.1 or later to use the Autolayout features of the editor.
Activating Autolayout
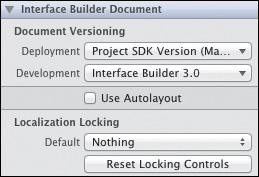
To activate Autolayout for MainMenu.xib, navigate to it and make sure the Utility area is visible with the File Inspector panel selected. Under the Interface Builder Document section (Figure 5.20), select the Use Autolayout check box.
Figure 5.20 The Interface Builder document’s file settings
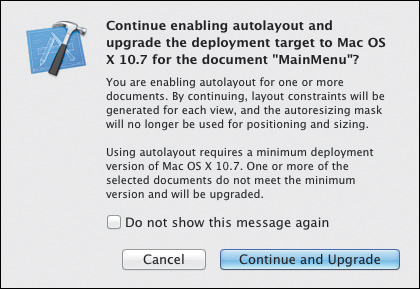
You may be prompted to upgrade your project’s minimum deployment version to Mac OS X 10.7 if it’s set to a lower version, as in Figure 5.21. Click the Continue and Upgrade button to accept the upgrade.
Figure 5.21 The Mac OS X 10.7 upgrade prompt
Note
Accepting the Autolayout upgrade and setting the minimum deployment version to 10.7 means your application will not run on versions of Mac OS X prior to 10.7. As mentioned, 10.7 is required for Autolayout.
Constraints
You’ll notice something different immediately. Figure 5.22 shows the new Constraints entries in Interface Builder’s Objects dock. Constraints are real objects, just like buttons and windows. They define the sizing and positioning behavior of the controls they constrain. Because they’re real objects, you can select, configure, or remove them in Interface Builder the same as you would a button or a window.
Figure 5.22 Constraint objects added to the document
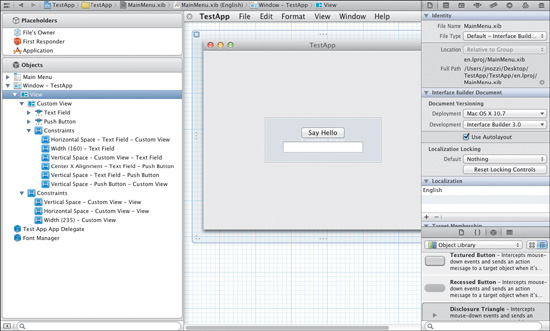
Figure 5.23 shows a vertical space constraint selected. This constraint manages the vertical space between the Say Hello button and the custom view’s top border. With Autolayout, dragging controls into a window or view and snapping them to the guides will automatically create the constraint that the system determined appropriate to maintain the best positioning.
Figure 5.23 A vertical space constraint selected
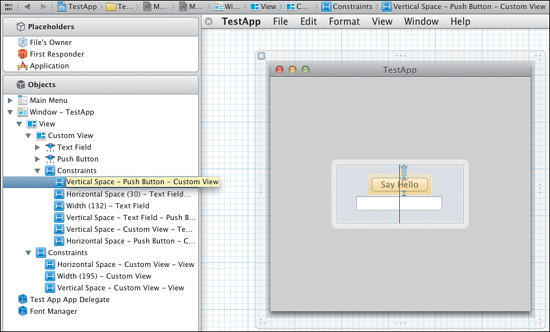
You can add constraints manually by choosing Editor > Pin from the main menu and selecting the desired type of constraint. We won’t explore each of these exhaustively here, but it’s important to note the variety of constraint types available: width, height, horizontal and vertical spacing, leading white space to superview, top and bottom space to superview, equal widths and heights, and more.
Constraints have properties that you can adjust in the Attributes Inspector pane of the Utility area. For example, if you select the text field’s Width constraint, you’ll see the Width Constraint settings in the Attributes inspector (Figure 5.24).
Figure 5.24 Constraint settings in the Utility area
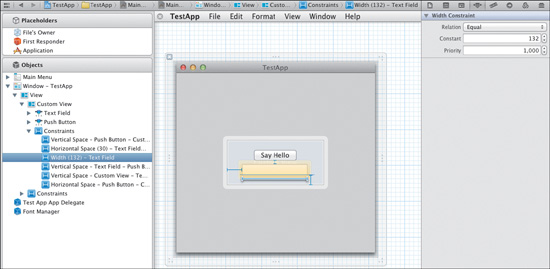
One behavior that didn’t make it past the upgrade to Mac OS X 10.7 (in this version, anyway) is the automatic width sizing of the custom view containing the button and field. Run TestApp to see for yourself.
Tip
For details about the Autolayout system, including the types of constraints and which ones are best for a given scenario, see the Cocoa Autolayout Guide at http://xcodebook.com/autolayoutguide.
To fix this (and explore adding constraints), select the custom view and choose Editor > Pin > Leading Space to Superview from the main menu. Select the custom view again and choose Editor > Pin > Trailing Space to Superview. Your window should look something like Figure 5.25.
Figure 5.25 The custom view’s leading and trailing space constraints
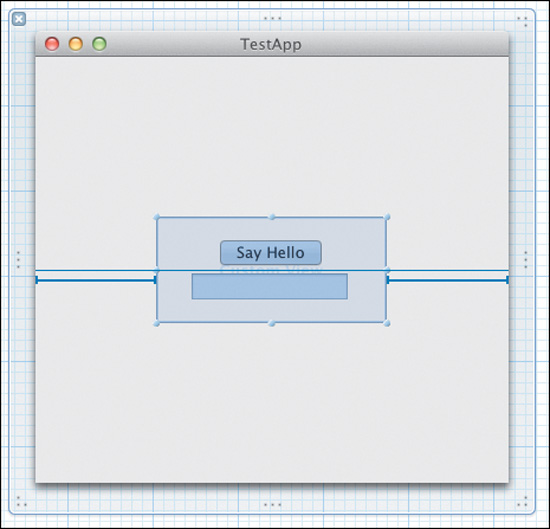
If you run TestApp now, you’ll see that this didn’t quite fix things. Although the button stays the same distance from the field below it, and the custom view seems to be resizing (as evidenced by the text field’s left edge following along), nothing else seems to be behaving itself.
The fix for the text field is easy enough. By snapping the left and right edges to the blue guides inside the custom view (Figure 5.26), the appropriate constraints are created for you automatically.
Figure 5.26 Creating constraints by snapping to guides
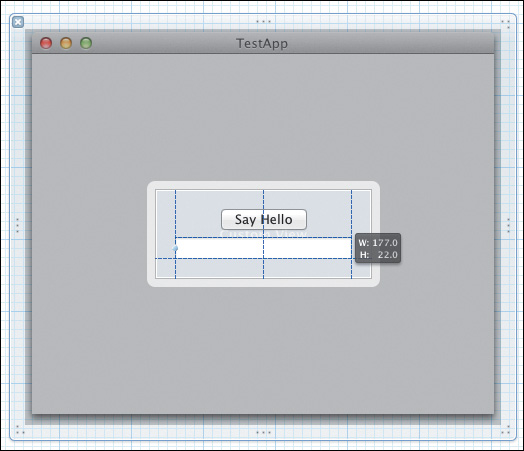
Figure 5.27 shows the constraints that were added as a result of your snapping the text field’s edges to the left and right guides. The constraints indicate that you want to maintain the space between the field’s sides and the sides of the superview’s bounds. Running TestApp once more shows that the Autolayout constraints now work as the original springs and struts did.
Figure 5.27 Newly added constraints
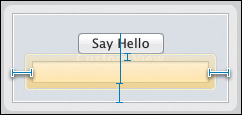
New Functionality
In the springs and struts demo, you needed the custom view so that the button and field would maintain the same vertical distance from each other as the window was resized (to prevent them from overlapping or growing apart).
Here’s where Autolayout with constraints really shines. To get this working the way it should have for years, you’ll remove that custom view and do it right. A simple trick to remove the view without moving the button and field is to select the custom view, then choose Editor > Unembed from the main menu. The custom view is removed and its subviews are left exactly as they are.
To fix the Autolayout constraints, just select the button and the field and drag them to the middle until they snap (as a group) to the blue vertical and horizontal centerlines that appear. You should see something similar to Figure 5.28. Run TestApp, and you’ll see an improvement. Although the text field doesn’t yet size horizontally as before, the button and the field maintain their positions relative to one another without the help of an otherwise pointless custom view. This is because of the vertical space constraint between the field and the button.
Figure 5.28 Simpler constraints for maintaining vertical spacing
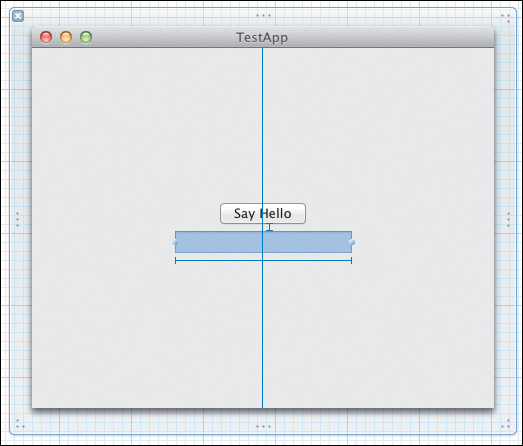
To finish the job, you can once again add the leading and trailing spacing to the text field. Select the text field, and choose Editor > Pin > Leading Space to Superview from the main menu; select the text field again, and choose Editor > Pin > Trailing Space to Superview. Select the text field once again, and your constraints should look something like Figure 5.29.
Figure 5.29 The final constraints for a horizontally growing text field
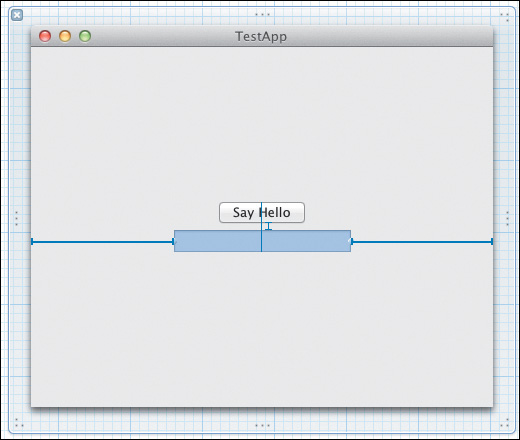
Now TestApp should behave as expected when you run it. This should give you a pretty good idea of how the new Autolayout system works, as well as some of its advantages over the springs and struts system.
Wrapping Up
Unless you write server applications and command-line tools, you will need to build at least a basic user interface. Now that you’re familiar with Interface Builder and the basics of actions and outlets, you have enough knowledge to get started with some test applications of your own for learning purposes. More complicated applications often require more than a single controller and likely more than a single nib. In the next chapter, you’ll learn how to add additional source code and resources (including additional nib files) to your project.
6. Adding Files to a Project
All but the simplest applications will likely need additional source code files, multiple nibs, artwork, HTML-based help files, and frameworks or libraries. There are two basic categories of files you might add to a project: source code and resources. In this chapter, you will learn how to add new or existing source and resource files to your project as well as how to remove them.
Adding Existing Files
There are two ways to add existing files to an Xcode project: You can use the Add Files sheet, or you can use drag and drop.
Using the Add Files Sheet
You can choose files to add to your project by using the Add Files sheet, which you can access by choosing File > Add Files To “TestApp” from the main menu.
The sheet (Figure 6.1) is a standard Open File sheet with additional options at the bottom. These options tell Xcode what do with the files when you click the Add button.
Figure 6.1 The Add Files sheet
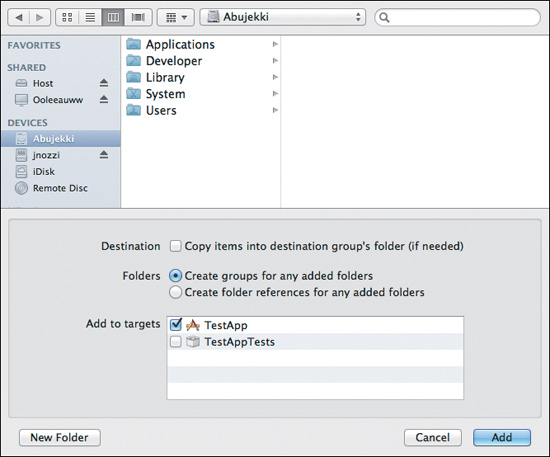
Destination
The Destination check box instructs Xcode to copy the selected files into the physical disk folder represented by the group that is currently selected in the Project navigator. Leaving this option deselected will cause Xcode to add a reference to the file without actually copying the file into the project.
Note
In most cases, it’s best to allow files to be copied into the project folder. This ensures all the parts of your project are kept together. However, referencing files outside the project folder has its advantages. One reason would be when using resources stored on a shared network volume for team development.
Folders
The Folders option lets you choose what Xcode will do when adding file system folders to the project. The first option creates groups of the same name as the folder and then adds the folder’s contents under that group. The second option creates folder references. These are similar to groups but represent the physical folder itself, preserving its file system hierarchy.
Add to Targets
The Add to Targets option instructs Xcode to add the files to the appropriate build phases for the selected targets within your project, depending on the file type. Xcode automatically adds source files to the Compile Sources build phase of the selected targets. Most other file types are added to the Copy Bundle Resources build phase. Targets and build phases are discussed in more detail in Part III.
Using Drag and Drop
In addition to using the Add Files sheet, you can add files to your project by dropping them into the Project navigator. A sheet (Figure 6.2) will appear, offering the same options shown in the Add Files sheet. Choose your options, and click Finish to add the files to the project.
Figure 6.2 The Add Files drag and drop options sheet
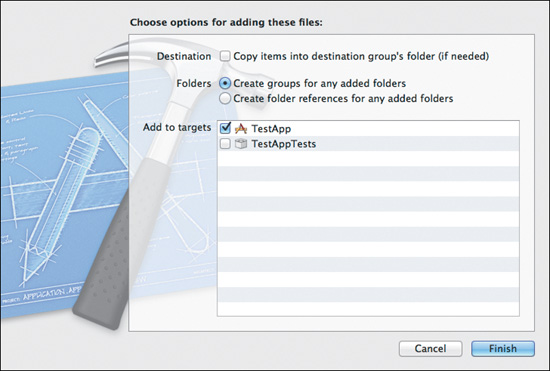
Note
It is common to add additional libraries and frameworks to a project. Adding libraries and frameworks, as well as packaging frameworks for distribution with the application, is discussed in depth in Part III.
Creating New Files
Xcode includes templates and options for creating a variety of common file types and adding them to your project. To begin adding a new file, choose File > New File from the main menu. A sheet similar to Figure 6.3 will appear.
Figure 6.3 The New File sheet
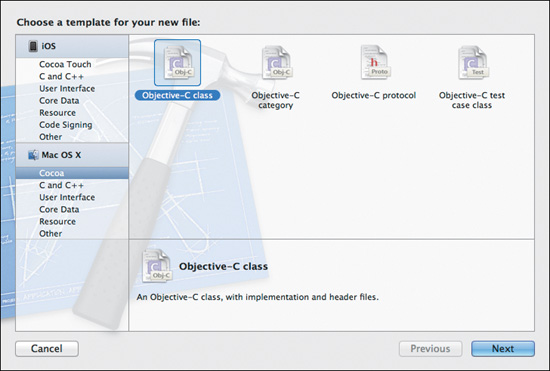
The sheet contains a sidebar on the left that categorizes the available templates first by SDK and then by file type. The top area to the right of the sidebar contains the specific templates that are available for the selected category. Select your desired template there. The area immediately below the templates shows a description of the selected template.
Some templates have additional options that allow you to specify things such as a superclass. Such options are displayed on the next sheet when you click the Next button. Keep clicking Next and you’ll eventually be prompted to save the file with a standard Save As sheet with a few additional options (Figure 6.4): the group in which to place the new file and the targets in which to include it. Click Save to complete the file creation.
Figure 6.4 The Save As sheet
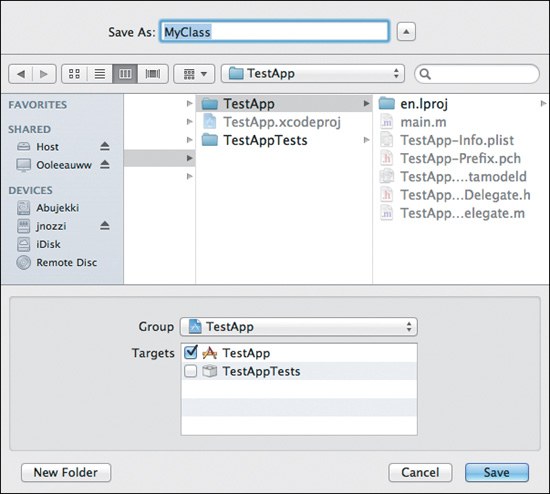
Using the File Template Library
You can also use the Utility area’s File Template library (Figure 6.5) to add files to your project. Just drag the desired template straight into the Project navigator and drop it in the desired folder. A Save As sheet similar to Figure 6.4 will appear with which you can name the file and specify its group and targets.
Figure 6.5 The File Template library
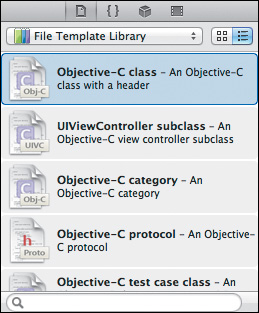
Removing Files from the Project
To remove a file from a project, select it in the Project navigator and press Delete. Xcode will prompt you to make a decision (Figure 6.6) to remove only the reference to the file within the project or to remove the reference and delete the file from disk. The operation cannot be undone, so you’ll need to restore the file if you’ve deleted it and then add it to the project as shown earlier in this chapter.
Figure 6.6 Deleting a file

Wrapping Up
A typical project will require adding many new source and resource files. You should also expect to remove files while maintaining and improving the application. You’ve seen how straightforward both of these actions are. In the next chapter, you’ll learn how to use the Source Editor effectively to write and edit source code.
7. Writing Code with the Source Editor
Xcode’s Source Editor is loaded with features that help you write, navigate, and research code. You’ve already used the Source Editor when working directly in the code. In this chapter, you’ll be introduced to more of its features.
Exploring the Source Editor Interface
The Source Editor (Figure 7.1) appears when you select source code files, when you view issues within source code files, or when you stop at a breakpoint in your own source in the debugger. This is the editor in which you will spend most of your time.
Figure 7.1 The Source Editor
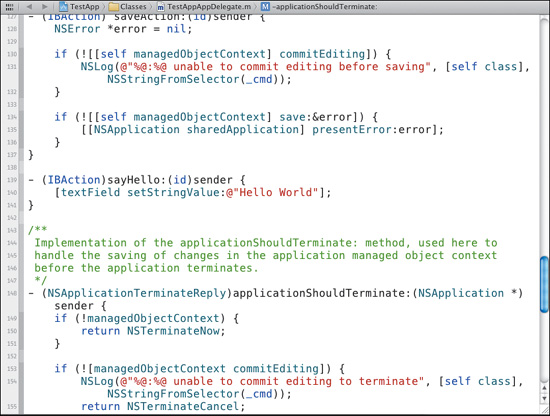
Note the gutter that runs along the left edge of the Source Editor. The gutter can display breakpoints, line numbers, and the code-folding and focus ribbon. Breakpoints are discussed in more depth in Chapter 9. You can toggle line numbers and the code-folding ribbon via Xcode’s preferences.
When editing source code, the Assistant window—which you saw in Chapter 3—can be used to open one or more files (or even separate parts of the same file) alongside the file displayed in the main editor. The Assistant in this case serves as a split-pane editor. You can use the various automatic modes (selected in the Assistant pane’s Jump Bar), such as Counterparts, Includes, Categories, and so on, which will cause the Assistant to display context-sensitive files depending on the main selection in the Project navigator. You can add as many panes as you like, and they’ll be arranged according to the settings you saw in Chapter 3.
Note
The Source Editor also has a Version Editor mode, the button to the right of the Assistant button. This feature is covered in Chapter 21.
Navigating Source Code
The Source Editor provides several ways to navigate your code. These include moving to symbols, showing only the code you want to work with, and splitting the editor to view multiple parts of the file at once.
The Jump Bar
One of the most common ways to move between symbols in your source is to use the Jump Bar discussed in Chapter 3 (Figure 7.2). When a source file with defined symbols is open, the last segment of the Jump Bar shows another level beneath the file itself—a list of the symbols within the source. The segment shows the symbol in which the insertion point of the editor resides. Choosing a different symbol takes you to its location in the source.
Figure 7.2 The Jump Bar showing the symbols belonging to the selected file
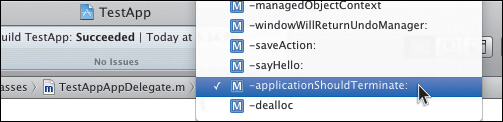
Jump to Definition
Another common navigation action is to jump to the definition of a symbol. The Source Editor makes this simple by turning symbols into hyperlinks while holding down the Command key (Figure 7.3). Clicking a symbol while holding the Command key jumps to its definition (which is not necessarily within the currently selected file). Recall the similar action for obtaining inline help—Option-clicking a symbol brings up the inline Quick Help pop-up.
Figure 7.3 Symbols made hyperlinks by holding down the Command key
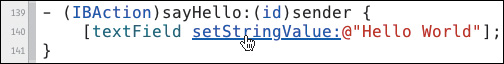
Code Focusing and Folding
The code-folding ribbon is enabled by default. It is the narrow strip in the gutter directly to the left of the text area of the Source Editor. The ribbon lets you concentrate on a particular scope within your code (anything within a matching pair of brackets) through folding or focusing. Nested scopes are depicted by darker shading within the ribbon (Figure 7.4). The boundaries of each scope are marked with arrows when you hover your mouse over them.
Figure 7.4 The code-folding ribbon showing nested scopes
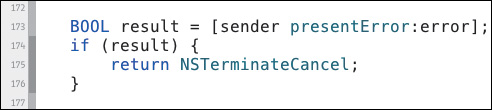
Focusing on Code
Focusing refers to darkening out all but the desired scope. Focusing does not obscure text; it only shades out anything outside the focused scope. Figure 7.5 shows the focused body of a simple if statement in the -applicationDidFinishLaunching: method.
Figure 7.5 Focused code, using the code-folding ribbon
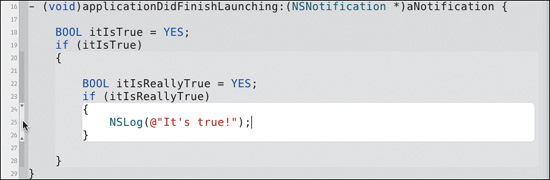
To focus on a scope, hover the mouse over the desired scope in the ribbon. Xcode will leave only the code within that scope unshaded.
Folding Code
Folding refers to collapsing and hiding the text within the desired scope. This does not change the text within the file but rather obscures it, making the file effectively shorter and easier to navigate. Figure 7.6 depicts the TestAppAppDelegate.m file with the -applicationDidFinishLaunching: method folded; the “folded” code is depicted as a yellow marker containing an ellipsis.
Figure 7.6 Folded code, using the code-folding feature
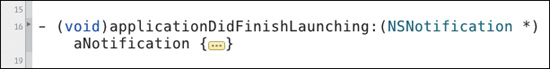
To fold code, click the desired scope in the folding ribbon. In cases where there are nested scopes, it’s easiest to click one of the arrows at either end of the desired scope.
Using Code Completion
Xcode’s Source Editor provides code completion of symbols as you type. When you begin to type a symbol that Xcode recognizes from your project or linked libraries and frameworks, an inline suggestion as well as a list of other possible suggestions appears (Figure 7.7).
Figure 7.7 Code completion suggestions
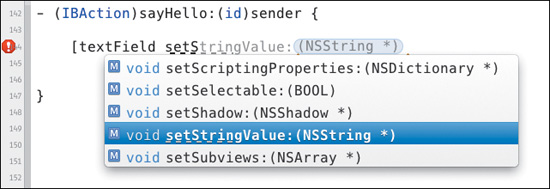
You can choose to accept the inline suggestion by pressing Tab. To select an alternative suggestion, use the arrow keys to choose and then press Return to use the selection. When there is more than one suggestion for a given prefix (such as NSSet or NSSetFocusRingStyle()), the common prefix will be underlined and pressing Tab will complete only up to the underlined portion. Subsequent Tabs will complete to the next whole or part of the inline suggestion.
Code completion can be canceled by pressing Escape or Control+spacebar. Completion can also be requested by placing the text insertion point at the end of an incomplete symbol and pressing Control+spacebar.
Although Xcode will automatically suggest code completion while you type by default, you can turn this feature off in the Text Editing panel of Xcode’s preferences. To do this, toggle the check box named “Suggest completions while typing.” When this feature is disabled, you may still request suggestions by pressing Control+spacebar while the text insertion point is at the end of an incomplete symbol.
Code completion uses the same information in the Symbol navigator, which you saw in Chapter 3. This information is derived from all available sources and libraries within the workspace, which means separate projects within the same workspace can share it among themselves. This feature is discussed in Chapter 16.
Exploring the Code Snippet Library
The Code Snippet library (Figure 7.8) is a place to keep common chunks of code such as a class declaration, a try/catch block, or a -dealloc method. The library comes with a number of ready-to-use snippets and allows you to add your own as well.
Figure 7.8 The Code Snippet library
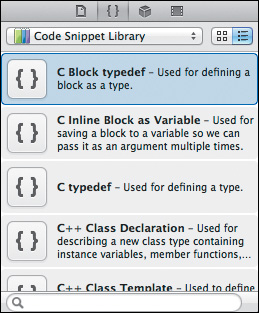
The Code Snippet library is located at the bottom of the Utility area. You can filter the snippets using the pop-up button at the top; you can choose to show all snippets, Mac OS, iOS, or your own custom snippets. You can also filter by keyword using the search bar at the bottom of the library panel.

Examining and Using Snippets
To examine the contents of a snippet, click to select it in the library. A pop-up (Figure 7.9) window will appear containing a description and the code snippet.
Figure 7.9 The snippet details pop-up
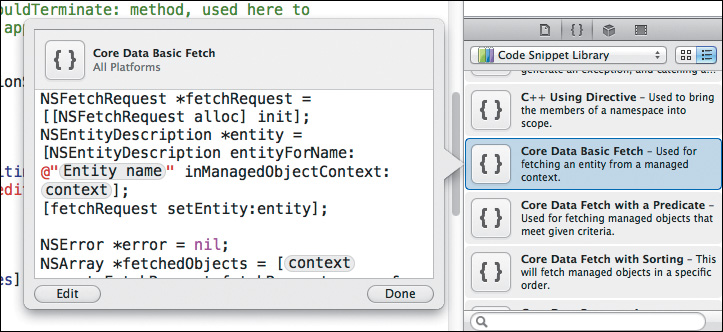
Using a snippet is as easy as dragging it into your source code. When you drop the snippet into your source, the full code will be present as if you had pasted it from the pasteboard.
Creating and Editing Snippets
To create a snippet, drag the desired “template” code into the snippet library. The snippet will be added to the list of available snippets. To edit the snippet, select it in the library. When the pop-up window appears, click the Edit button in the lower-left corner. The pop-up will reveal editing controls (Figure 7.10).
Figure 7.10 The snippet details pop-up in edit mode
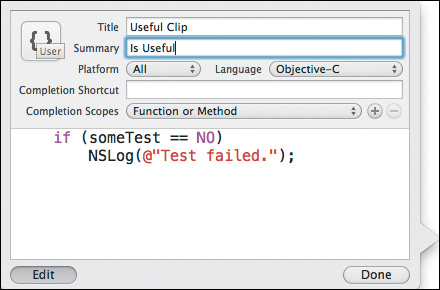
You can set the title and description that appear in the library list, and the platform and language the snippet targets. You can also set a completion shortcut to use when editing code. Finally, you can edit the snippet itself. When you’re finished editing, click Edit or Done.
An example of a useful snippet is a ready-to-go set of the three primary NSTableViewDataSource protocol methods. When using this protocol to populate an NSTableView programmatically, the quickest way to get up and running used to be to copy the method signatures from the documentation and then insert the brackets, the if conditionals for determining the table being operated on, and so on. Now you need to define this only once, format it as you want, and then save it as a snippet for reuse in any future projects and workspaces.
You can also insert placeholder tokens that are parts of the snippet (such as arguments) that must be filled in to complete the code. For example, to add a placeholder for an NSNumber argument, you would type <#NSNumber#> where the argument belongs. When the snippet is used, the text that appears between the hash marks is what will appear in the snippet. The token’s text should serve as a helpful prompt regarding what should be filled in when using the snippet.
The Assistant
When editing source files, the Assistant can act as a smarter split-screen editor, showing (and allowing you to edit) different parts of the current file or any other file of your choosing. As mentioned in Chapter 3, the Assistant can become contextually aware, depending on the behavioral mode you select.
In any context, you can manually choose a file to display in the Assistant and of course create as many assistants (each with any behavioral mode you like) as you need.
Available Assistant Behaviors
Counterparts behavior shows files that are considered to be counterparts of the selected item. A counterpart might be the header file for a selected implementation file, or vice versa.
Superclasses and Subclasses behaviors show any known superclasses or subclasses of the selection, respectively.
Siblings behavior shows any files within the same Project navigator group as the selection.
Categories and Protocols behaviors show available Objective-C categories or protocols for the selected file, respectively.
Includes and Included By behaviors show all files that include the selection or those included by the selection, respectively.
Wrapping Up
You’re now familiar with the basics of Xcode’s Source Editor. Additional features, including the Refactor tool, Fix-it, and the ability to rename symbols, will be covered in depth in Part III. In the next chapter, you’ll learn how to perform a project-wide search and replace.
8. Searching and Replacing
Xcode provides many ways to search and filter project members, source code, and documentation. You briefly scratched the surface of searching your source code with the Search navigator in Chapter 3. In this chapter, you’ll learn how to search and filter project members and how to perform replacements to all or specific parts of your project source.
Using the Search Navigator
As mentioned in Chapter 3, initiating a basic search is simple. Type a term into the familiar search box at the top of the Search navigator and press Return. The results are displayed in the navigator outline (Figure 8.1), organized by source file. Selecting a file or a matching line within a file will cause Xcode to navigate to it in the appropriate editor. The search results themselves can be further refined by typing an additional term in the search field at the bottom of the Search navigator. You can start a project-wide search by choosing Edit > Find > Find in Workspace from the main menu.
Figure 8.1 The Search navigator showing matches
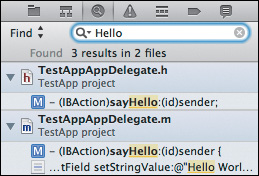
The basic scope of the search can be selected as you are typing the search term, before you press Return. A context menu will appear as you type (Figure 8.2), allowing you to limit the scope to your project or to your project and all frameworks, as well as choosing a “begins with” or “contains” type of search. You can select one of these options rather than pressing Return; Return always chooses the first option, which is defined by your chosen find options.
Figure 8.2 The search options context menu
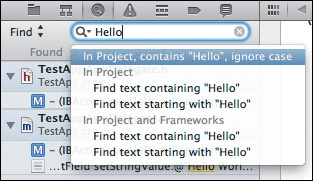
Tip
You can jump immediately to the Search navigator by pressing Command+Shift+F (for Find). The search field is focused so you can immediately begin typing your search term.
Using the Find Options
A number of options are available to specify your search. Click the magnifying glass icon at the left edge of the top search field to reveal a context menu. Choose Show Find Options, and the Find Options panel will emerge (Figure 8.3).
Figure 8.3 The Find Options panel
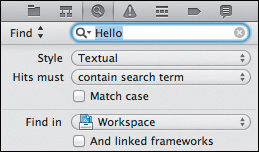
Using the Style Option
This option allows you to specify a textual search or a regular expression search. A textual search matches the literal text term you type. A regular expression (or regex) search will search for patterns using the regular expression syntax.
Although you can perform reasonably complex changes with carefully chosen search-and-replace strings, regular expressions are a far more powerful pattern-matching tool. Support for regex is built directly into many modern APIs and text editors. Although the subject is beyond the scope of this book, there exists an abundance of books and online tutorials.
Using the “Hits Must” Option
This option allows you to specify the location of the search term within the searched items. That is, you can choose to view any results containing the term, only those that begin or end with the term, or only those that exactly match the entire term.
Using the Match Case Option
This option lets you choose whether the search is case sensitive. For example, with Ignore Case selected, the term hello would produce three results across two files in your TestApp project: the -sayHello: method in your header and implementation files, and the @”Hello World” string in the body of the -sayHello: method. If you choose Match Case, there would be no results since all the instances of the word hello are capitalized.
Using the “Find In” Option
This option lets you narrow the scope to specific projects in a multi-project workspace or any custom scope you define. Workspaces are covered in detail in Chapter 16. Custom scopes are covered in the next section. You can also choose to include any frameworks your project links by selecting the “And linked frameworks” check box.
Custom Find Scopes
This powerful feature lets you define search scopes with user-defined rules that can match locations, names, paths, extensions, or file types. To define a custom scope, choose Custom from the Find In pop-up button menu. A sheet will appear listing custom scopes (empty by default) and their associated rules (Figure 8.4).
Figure 8.4 The Find Scopes sheet
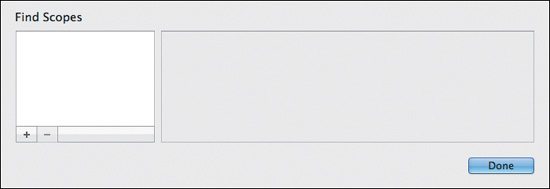
A good use case for a custom scope would be to narrow it to only HTML files within the workspace. This can be useful if you include an HTML-based Mac Help Book with your application and need to find all references to a feature you intend to rename or expand upon.
Creating a Custom Find Scope
To create a custom find scope, make sure the Find Scopes sheet is open and then click the plus (+) button at the lower-left edge of the sheet. A new scope will be created with a basic rule (Location is within workspace). Double-click the My Scope entry in the scopes list, rename it to something useful, such as HTML Source, and press Return.
Since the default rule narrows the scope to matches anywhere within the current workspace, you need only one additional rule to narrow it to HTML files. To add this rule, click the plus (+) button to the right of the first rule (Location is within workspace). A new default rule will appear (Name is equal to). Click the Name pop-up and select Type. Click the any pop-up and select “html.” Your Find Scopes sheet should now look like Figure 8.5.
Figure 8.5 A new custom find scope
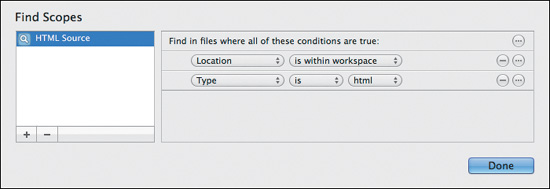
Note
Help Book is Apple’s term for the application’s documentation. Application Help Books are accessed through the application’s Help menu.
Click the Done button to close the sheet. The new scope is now selected in the Find In pop-up and will remain as one of the available search scopes. You can edit or delete it or add new scopes at any time by choosing the Custom option from the Find In pop-up.
With Ignore Scope selected in the “Hits must” pop-up and the new HTML Source scope selected in the Find In pop-up, type hello into the search field again and press Return. Note there are no matches because the only files in your project that currently contain the term are not HTML files.
Replacing Text
To the left of the top search field is a pop-up button with Find selected. Click the pop-up and choose Replace. More options are revealed below the search field (Figure 8.6). An additional field, in which you can specify the replacement term, accompanies three buttons (Preview, Replace, and Replace All). When the navigator area is not wide enough to contain all three buttons, the Preview button is represented by an icon representing a loupe.
Figure 8.6 The replace options
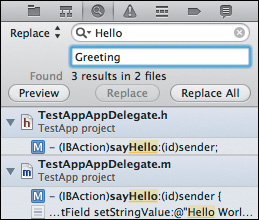
Note
The additional Find options revealed when choosing Show Find Options from the search field’s magnifying glass menu are also available when performing a Find and Replace.
You can replace specific instances by selecting them (hold down the Command key and click individual results) and clicking the Replace button. This will replace only those instances with the replacement term. To replace all instances, click Replace All. Xcode will replace the desired instances, and the changes will be saved automatically when you build or close your project.
Previewing Replacements
Xcode has a visual replacement preview interface for previewing replacements. When you click the Preview button, a sheet similar to Figure 8.7 appears. The preview sheet lets you “cherry-pick” the replacements you want and view the effect each change will have before you apply it.
Figure 8.7 The Replace preview sheet
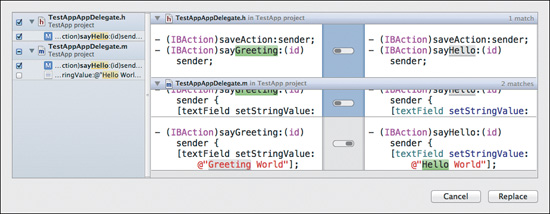
To test this, assume you want to change only the -sayHello: action in your project to -sayGreeting:. You don’t want to change the actual message that is presented to the user, only the method name.
Perform a case-sensitive search for Hello. Once you have results, make sure Replace is selected in the pop-up so that the replace options are revealed. Enter the term Greeting in the replace field.
Click the Preview button to reveal the replacement preview sheet. As in Figure 8.7, select the -sayHello: method declaration in the header file and the implementation in the implementation file. Leave the line with the @”Hello World” string deselected. You can do this by placing a check mark next to the desired matches in the left-hand outline view or by flipping the switches to the right in the preview panel.
Click the Replace button in the lower-right corner of the sheet to see your changes applied. You may be prompted to take a snapshot of the project so you can revert the changes.
Once the changes are applied, you’ll notice that only the @”Hello World” string was unchanged, as expected. If you build and run your application, you’ll also notice complaints being logged to the console and that the Say Hello button no longer works. You’ll need to reconnect the button to the newly named -sayGreeting: method as you learned in Chapter 5.
Blindly replacing symbols (as opposed to literal strings) is seldom a victimless crime. It can break outlet and action connections in Interface Builder files, unintentionally replace substrings within other strings to ill effect, and more. A much better way to rename a symbol throughout a project is to use the Refactor tool. This tool can rename a symbol and replace any references to it, as well as even rename classes and associated files without breaking their connections or references. The Refactor tool is covered in Chapter 13.
Note
Snapshots are covered in Chapter 21.
Searching within Files
You can also perform a search or a search and replace within the currently selected source file in the Source Editor. The simpler UI works much the same way as the Search navigator, including additional options (by clicking the search field’s magnifying glass icon) and a replace field (Figure 8.8).
Figure 8.8 The Source Editor’s Find panel
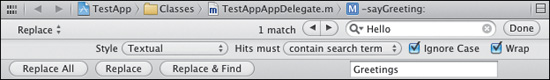
To find a word or phrase, select Edit > Find > Find from the main menu. Enter a search term and press Return. You can navigate the matches within the file using the back and forward buttons to the left of the search field.
Although there is no preview as with a project-wide search and replace, you can choose Replace All to replace all matches, Replace to replace the current selection, or Replace & Find to replace the current selection and select the next match.
Click Done to close the Find panel.
Tip
You can initiate a search within the Source Editor by pressing Command+F. This is similar to the Command+Shift+F shortcut that opens the Search navigator. You can navigate the matches by pressing Command+G to go to the next match and Command+Shift+G to go to the previous one.
Wrapping Up
You’ve seen how you can search and replace within your project or the currently selected file. The comprehensive set of options—including user-customizable, rules-based scopes—is flexible enough to help you find exactly what you’re looking for. The replace preview system lets you cherry-pick exactly what you want to replace. All this code editing and text replacing is bound to introduce bugs. In the next chapter, you’ll learn the basics of debugging an application using Xcode’s built-in debugger.
9. Basic Debugging and Analysis
Xcode provides a comprehensive set of well-integrated tools to approach the tasks of debugging and analyzing your applications. In this chapter, you’ll learn how to use Xcode’s built-in debugger. In Chapter 17, you’ll learn more advanced debugging techniques.
Compile-Time Debugging
In Xcode, errors, warnings, and analyzer results are collectively called issues. Xcode is constantly compiling and checking your code for issues. Errors are red, warnings are yellow, and static analyzer issues are blue. Like any modern integrated development environment, Xcode flags issues by highlighting them directly in the source code (Figure 9.1) with a corresponding icon in the gutter along the left edge of the Source Editor. In addition to the immediate issues in the selected source file, all issues Xcode finds in your entire workspace are displayed in the Issue navigator (as described in Chapter 3).
Figure 9.1 A compiler issue highlighted in the Source Editor
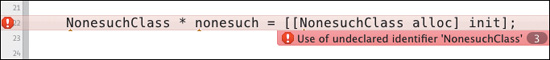
Using the Static Analyzer
Xcode integrates the Clang Static Analyzer, which goes a step beyond basic compiler errors and warnings. It knows enough about C, Objective-C, and Cocoa patterns to find memory management problems, unused variables, and more. Its integration with Xcode means it can show an impressive amount of detail, including the path of execution leading to the problem and the conditions that caused it along the way.
Figure 9.2 shows an analyzer issue. In this case, an instance of NSArray has been created on one line and leaked on the next. On each line, the instructions that led to the problem are highlighted and explained.
Figure 9.2 An analyzer issue highlighted in the Source Editor

Notes

You can learn more about the Clang Static Analyzer at http://clang-analyzer.llvm.org.
More complicated analyzer scenarios are explored in Chapter 17.
Fixing Errors with Fix-it
You can fix common errors with Xcode’s Fix-it feature. When you click an issue in the Source Editor, Xcode will display a pop-up window with suggestions for possible fixes if it has any to offer (Figure 9.3). To apply a suggested fix, click the suggestion in the Fix-it pop-up. The code will be changed according to the chosen fix.
Figure 9.3 The Fix-it window suggesting a fix
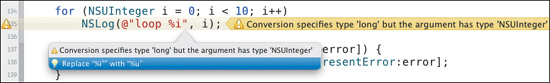
Using the Log Navigator
The full results of each build are stored in the Log navigator, which you explored in Chapter 3. You can filter and explore the results. Double-clicking an issue will navigate to the corresponding file. Figure 9.4 shows a build error that resulted when class Bob was referenced but not declared. It’s a good idea to expand issues by clicking the disclosure triangle to the left of the issue. This reveals crucial details about the issue that can help you figure out how to fix it.
Figure 9.4 The undeclared Bob build error in the Log navigator
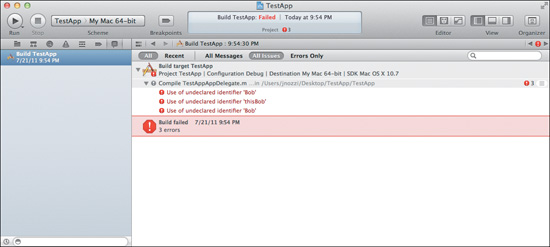
Runtime Debugging
For runtime debugging, Xcode integrates with GDB and the new LLDB debugger. Xcode provides a UI for managing breakpoints, controlling program execution, exploring the threads and stacks of the running application, accessing the debugger console, and more.
By default, all newly created Xcode projects are run in the debugger. The application will pause at the point of failure if it crashes or at any breakpoints you set if they’re encountered. The Debug area (Figure 9.5) appears when running an application with a debugger attached. The current instruction is highlighted with a green arrow in the Source Editor gutter.
Figure 9.5 TestApp paused in the debugger
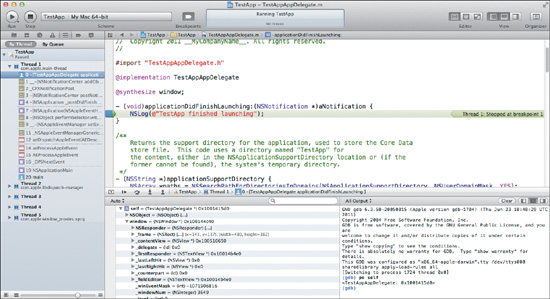
Note
Whether or not a debugger is attached to the running application is controlled by the active scheme. Schemes are covered in Chapter 14.
Using the Debugger Bar
The basic program execution controls—including Step Into, Step Over, Continue, and others—and the Threads and Stacks navigator are located in the Debugger Bar (Figure 9.6) at the top of the Debug area. You can pause a program (or trigger other actions in Xcode) by setting breakpoints. You can navigate threads and stacks using the navigation pop-up.
Figure 9.6 The Debugger Bar

Using the Basic Controls
The Pause/Continue button pauses and resumes program execution. The keyboard shortcut for this action is Control+Command+Y.

The Step Over button executes the currently highlighted instruction while execution is paused. If the instruction is a routine, the routine is executed and the debugger stops at the next instruction in the current file. The keyboard shortcut is F6.

The Step Into button executes the currently highlighted instruction while execution is paused. If the instruction is a routine, the debugger moves on to the first line of that routine and pauses. The keyboard shortcut is F5.

The Step Out button finishes the current routine and jumps back to the calling routine or next instruction after the routine was called. The keyboard shortcut is F8.

You can find additional debugger actions under the Product > Debug submenu of the main menu.
Tip
Holding Option or Option+Shift while clicking the step buttons will vary the functionality of the buttons. You can step through assembly instructions or through only the instructions in the current thread. See the Xcode documentation for details.
Navigating Threads and Stacks
The Threads and Stacks navigator, which occupies the rest of the Debugger Bar, is used to switch between threads and navigate the call stack. It works in the same way as the Jump Bar. Figure 9.7 shows the current call stack while TestApp is paused at a breakpoint in the -applicationDidFinishLaunching: method.
Figure 9.7 Viewing the call stack in the Threads and Stacks navigator
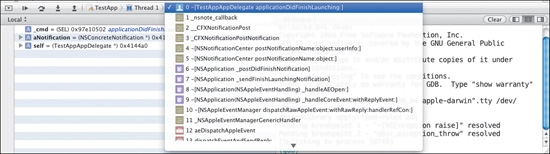
Working in the Console
The console (Figure 9.8) displays the console output of your application and, while debugging, serves as a command-line interface to the debugger (whether you’re using GDB or LLDB).
Figure 9.8 The debugger console
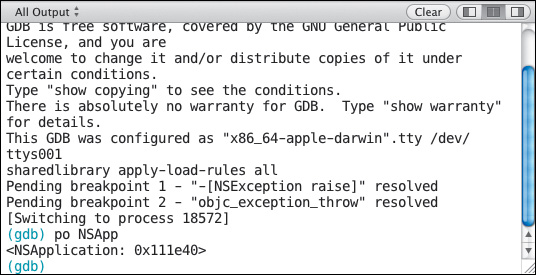
The output can be filtered to show only debugger or target output using the pop-up menu in the upper-left corner of the console area. The debugger prompt is available only when the application is paused in debug mode. When the prompt is available, you can click to the right of the text prompt and input debugger commands, such as the GDB command po (print object).
The panel to the left of the console area, the Variables pane (Figure 9.9), shows the current variables and registers when debugger is paused. The pop-up button in the upper-left corner of the pane can be used to choose all variables, those that were recently accessed, or variables local to the current scope only.
Figure 9.9 The Variables pane
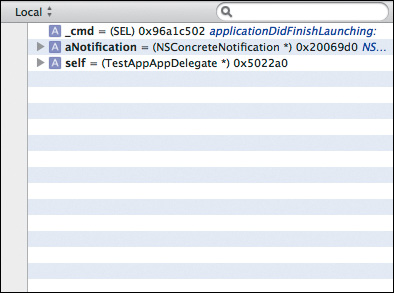
Using Breakpoints
Breakpoints are used to pause the application (or perform other actions) in the debugger when a particular instruction (point in code) is reached. There are several ways to manage breakpoints in Xcode 4.
Enabling Breakpoints
For Xcode to stop at breakpoints in the debugger, breakpoints must be active. You can use the Breakpoints button at the top of the project window to activate or deactivate all breakpoints. If this button is not selected, the debugger will stop only when a program signal (such as a memory-management-related crash) is encountered. Alternatively, you can use Command+Y to toggle breakpoints.

Note
In previous versions of Xcode, Command+Y would launch the targeted application in the debugger, whereas Command+R would run it without the debugger attached. Starting in Xcode 4, pressing Command+Y toggles activation of all breakpoints, and the running application is effectively always in debug mode.
Managing Breakpoints in the Source Editor
You can set breakpoints in the Source Editor by clicking the gutter on the left edge of the editor beside an instruction. A blue marker appears, showing that a breakpoint is set at that location (Figure 9.10).
Figure 9.10 A breakpoint set in the greeting action of TestApp
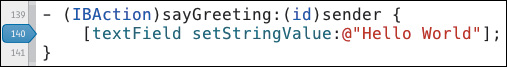
You can toggle individual breakpoints in the editor by clicking them once. The breakpoint will turn lighter, appearing translucent when inactive. To remove a breakpoint entirely, you can drag it from the gutter and release it. It will disappear in a puff of animated smoke to indicate it has been deleted.
You can also set breakpoints in the editor with a keyboard shortcut. Command+\ (Command and the backslash character) will set a breakpoint at the current line in the code. If a breakpoint already exists, the shortcut will remove it.
Using the Breakpoint Navigator
As you learned in Chapter 3, you can use the Breakpoint navigator to manage individual breakpoints, navigate your project by set breakpoints, or view only active breakpoints. There are a few more important features to note:
• Right-clicking a breakpoint in the navigator and choosing Edit Breakpoint from the context menu reveals a pop-up window that presents a number of options (Figure 9.11). You can set a condition under which the reached breakpoint will break (such as x == 21); ignore the breakpoint a number of times before breaking; add one or more actions (such as playing a sound, logging something to the console, executing a shell command) when the breakpoint is reached; and automatically continue after performing actions.
Figure 9.11 The breakpoint options pop-up
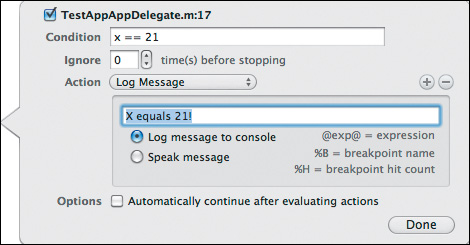
• You can also set exception or symbolic breakpoints using the + button at the bottom of the Breakpoint navigator. When you add either type of breakpoint, a pop-up similar to the breakpoint options pop-up will appear (Figure 9.12), allowing you to further specify their individual options.
Figure 9.12 The options pop-up for an exception breakpoint
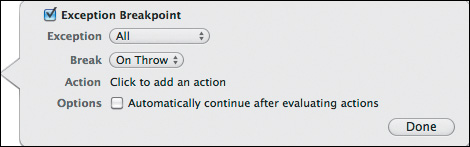
Note
Refer to Xcode’s documentation for a full explanation of the various options for user, exception, and symbolic breakpoints.
Interacting with the Source Editor
While the application is paused, you can interact with the debugger directly in the Source Editor in several helpful ways.
Inspecting Variables in the Source Editor
The Variables panel isn’t the only way to examine the state or content of variables in the debugger. While the application is paused, you can hover the mouse pointer over a variable to examine it as long as it is within the current scope. A yellow box will appear, showing the details of the inspected variable (Figure 9.13).
Figure 9.13 Examining a variable in the Source Editor
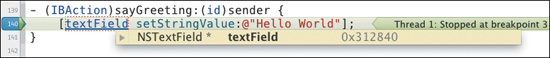
Note
You’ve seen that pointers to Objective-C objects can be examined in the Source Editor, in the Variables panel, and when using the print object command in the console. The information that is displayed is the result of calling the -description method, inherited from the NSObject class.
Using Continue-To-Here
Sometimes it may be advantageous to continue to a point in your code farther down from where you’re currently paused or to continue through a loop back to the top. You can continue execution to the desired point using the continue-to-here command.
To continue execution to a chosen instruction, hover your mouse pointer over the gutter next to the instruction. A green button will appear (Figure 9.14). Click the button to execute up until that instruction.
Figure 9.14 The continue-to-here button
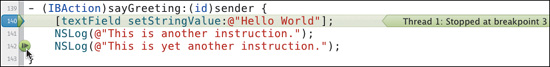
Moving the Execution Pointer
You can drag the execution pointer and place it anywhere within the local scope. You can use this to skip parts of code or to jump backward to repeat instructions. To move the execution pointer, grab the green arrow along the left edge of the Source Editor and drag it to the desired instruction.
Moving the execution pointer backward to repeat instructions will not undo the instructions that were just executed. It will execute them again when you continue or step through your code. If you are new to debugging, missing this distinction can be confusing.
Using the Debug Navigator
As you learned in Chapter 3, the Debug navigator shows the threads and stacks when execution is paused in the debugger. This view represents the same information found in the Threads and Stacks navigator in the Debugger Bar. You can organize the navigator by thread or by Grand Central Dispatch queue.
You can further refine the navigator using the controls at the bottom. The button at the left side of the slider ( ∑ ), when enabled, filters the threads and stacks to show only the threads that have your code in them or for which debugging symbols exist. The slider controls how much stack detail to show—the left side shows only the top frame of each stack while the right shows all stack frames.
Note
For more information about Grand Central Dispatch, refer to the Apple developer documentation.
Wrapping Up
You should now have a firm grasp of the basic debugging facilities that Xcode 4 offers. You’ll find more debugging techniques in Chapter 17. In the next chapter, you’ll explore Xcode’s graphical data modeler and use it to add some data management and storage capabilities to TestApp.
10. Using the Data Model Editor
Xcode comes with an integrated data model editor tool. In this chapter, you’ll learn how to use the data modeler to give your application the ability to create, manage, manipulate, save, and load its data without writing a single line of code.
Introducing Core Data
A data model gives your application a well-defined structure for managing and persisting its data. The model corresponds with the Model layer of the Model-View-Controller design pattern. There are a number of ways to manage your application’s model layer but Apple has created a solution that works well in many situations: Core Data. This facility is well integrated with Xcode.
Apple is very careful to specify Core Data as an “object graph management and persistence framework.” Although the framework shares much in common with a relational database, it is important to note that it is not intended to act as one. Core Data is primarily focused on the needs of desktop applications (though it can be used in server applications as well, provided care is taken to manage it properly).
The framework provides standard persistent store types (binary, SQLite, and XML) and can be extended with custom store types. The minimum requirement the developer must supply is a managed object model, which describes the application’s entities (such as Person, Group, Account, or BlogPost) and their relationships to one another, if any. With this model and UI to manipulate it, Core Data is smart enough to handle managing, saving, and loading your application’s data without writing a single line of code. In practice, however, a moderately complex application will need further customization.
There are a few key concepts you’ll need to understand to use this API and its related Xcode features.
Note
Core Data relies on several underlying Cocoa technologies. This is considered an advanced topic. This book will introduce the basic concepts but will focus on Xcode’s Core Data features only. For more information, refer to Apple’s developer documentation.
Managed Object Models
A managed object model (MOM) is Core Data’s facility for describing the application’s data model. It can be described in code but is most often built with the Data Model Editor. When you create a project from a template that uses Core Data, all the necessary code is included as well as an empty MOM file that shares the application’s name. For TestApp, the file is TestAppDataModel.xcdatamodel.
Persistent Stores
A persistent store is the on-disk representation of the data created with your managed object model. Core Data supports three store types by default: XML, SQLite, and binary. Each store type has its advantages and disadvantages (see the Core Data documentation for details). Additionally, Core Data supports developer-implemented custom store types. The managed object model “does not care” about how (or even if) the data is persisted in a store.
Developers new to Core Data sometimes confuse the model with a data store created using the model. Some even look for a way to browse (in Xcode) the data they put into a store with their application. It’s important to understand that the data created in your application is not stored in the managed object model but rather in a store.
Note
Throughout the rest of this chapter, the term model can be assumed to refer to a Core Data managed object model.
Entities
Entities represent your model objects. Entity in this context means the same as it does in relational databases. It is a description of a type of object and its properties. In Core Data terminology, a managed object is an instance of an entity.
When an entity is selected in the editor, containers appear that allow you to add attributes, relationships, and fetch properties.
An attribute requires, at minimum, a name (such as lastName or age) and a type (such as a string or a number). A relationship requires a name (such as parentFolder) and a destination entity (such as Folder) and can be a one-to-one or one-to-many relationship.
Managed Object Contexts
A managed object context can be thought of as a “scratch pad,” a context in which managed objects are created or pulled from a persistent store, potentially modified, and potentially saved back to the store. To work with Core Data, you must have at least one context.
You may have multiple contexts to keep sets of changes separate. For example, a desktop application might create a separate context for an “import” task that runs in the background while the user continues using the existing data. A server application might have one context for each session (connected user) to isolate their activities until they’re ready to “commit” any additions, changes, or deletions they may have made.
Separate contexts are merged using one of several available merge policies that dictate how conflicting changes are to be handled. The merged contexts can then be persisted to the store. In the case of this import example, the contexts can be merged (and persisted) when the import completes successfully, revealing the newly imported data to the user in the main user interface.
Using the Data Model Editor
When you select an .xcdatamodeler file in the Project navigator, the file is opened with the Data Model Editor (Figure 10.1). The editor is separated into two main areas: the outline and the main editor area. The Jump Bar reflects the model’s hierarchy, and the Utility area, when visible, shows the details of the selected items in the Data Model inspector.
Figure 10.1 A simple MOM in the Data Model Editor
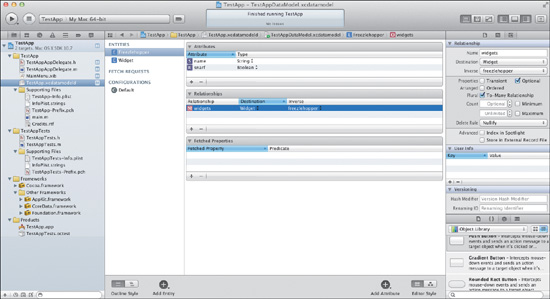
The outline represents the entities, fetch requests, and configurations of the MOM. New entities, fetch requests, and configurations can be added by clicking and holding the blue Add Entity ( + ) button in the bottom toolbar or by using the Editor > Add... items in the main menu. These items can be deleted by selecting them and pressing Delete.
The main editor has two primary styles: table and graph. Table mode is what you saw in Figure 10.1. Graph mode is shown in Figure 10.2 and represents the relationships and inheritance of the model. When using the graph editor style, you will need to use the Utility area to edit entities and their attributes and relationships.
Figure 10.2 A MOM in the model graph mode
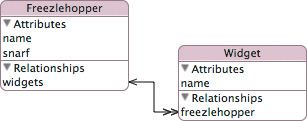

Creating a Basic Data Model
Now that you’ve toured the Data Model Editor, you’re ready to expand TestApp’s capabilities by adding a simple data model. For this example, assume the goal is to add the ability to create, edit, save, and restore simple to-do items. A to-do item will have a content string and a due date.
To create the to-do entity, navigate to the TestAppDataModel.xcdatamodel file. Click the Add Entity button. An entity will be added with a default name of Entity, ready to be renamed. Type ToDoItem, and press Return to rename the entity.

Add the due date attribute by clicking the Add ( + ) button in the Attributes table in the editor. Change the attribute name to dueDate and set its type to Date. Do the same for the content attribute, setting its name to content and its type to String. The MOM should now look like Figure 10.3.
Figure 10.3 TestApp’s managed object model
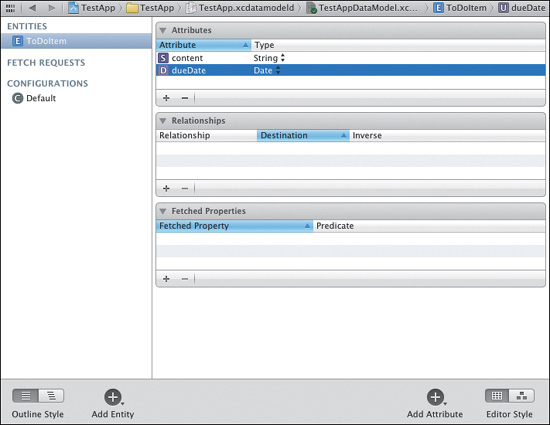
That is all that is required to give TestApp the ability to maintain and persist a list of to-do items. To let the user manipulate a list (including adding, editing, and deleting), you’ll need to add a user interface (UI).
Creating a UI for the Model
To manage TestApp’s to-do items, you’ll need a table view and a few buttons to add and remove items. Cocoa’s NSArrayController object can fulfill all of the controller layer needs with no code via the Cocoa Bindings mechanism. To create the interface, select the MainMenu.xib file in the Project navigator. The file will open in Interface Builder.
Laying Out the Interface
First, make room for more user interface elements. You can do this by moving the Say Hello button and its text field to the top of the window (Figure 10.4). You could also make more room by making the window larger.
Figure 10.4 Making room in the TestApp interface
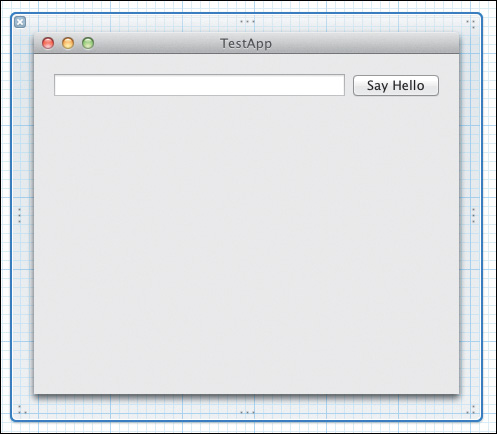
Drag two NSButtons into the window (Figure 10.5). Position the buttons, then double-click each and set their titles to Add and Remove. You should end up with something like Figure 10.6. These buttons will let the user add and remove instances of the ToDoItem entity.
Figure 10.5 Adding buttons to the interface
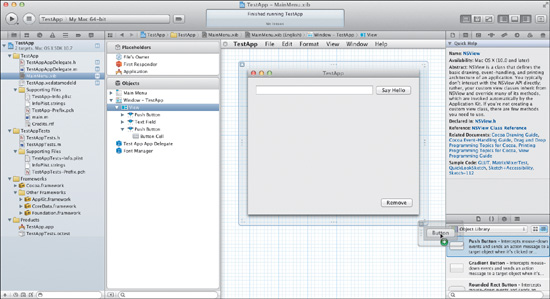
Figure 10.6 The Add and Remove buttons
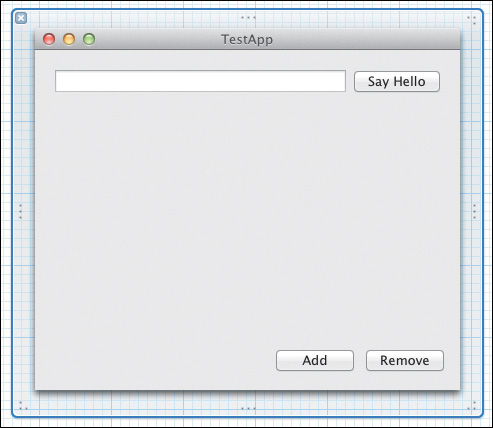
To display the to-do items to the user and provide a means by which to manipulate them, a simple table view will work just fine. Find the NSTableView control and drag one into the window, positioning it as in Figure 10.7. Double-click the headers of each of the two columns and set them to Due and Description. You’ll bind these columns to the dueDate and content attributes of the ToDoItem instance the table will display.
Figure 10.7 Placing the table view control into the interface
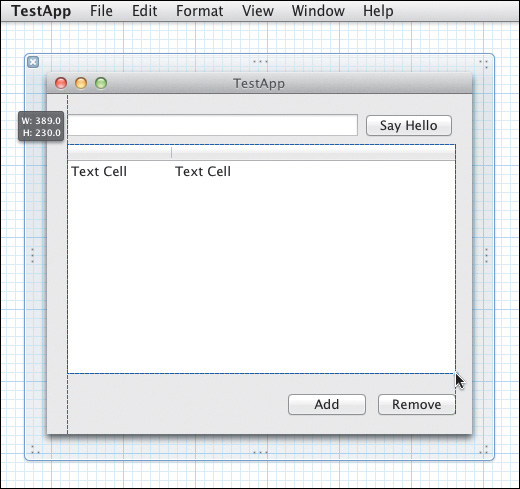
The Due column will need some extra formatting to display dates properly. A cell formatter can be used to do this automatically for all cells in the column. Drag an NSDateFormatter into the Due column just beneath the column header, atop the words Text Cell (Figure 10.8). This will create and attach a date formatter to the prototype cell the column uses to represent each row’s content.
Figure 10.8 Adding a date formatter
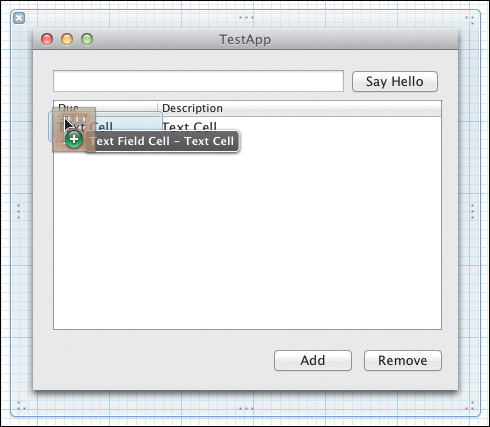
The date formatter’s settings should be visible in the Attributes inspector. Choose Short Style from the Date Style pop-up. Your user interface should now resemble Figure 10.9.
Figure 10.9 The new user interface
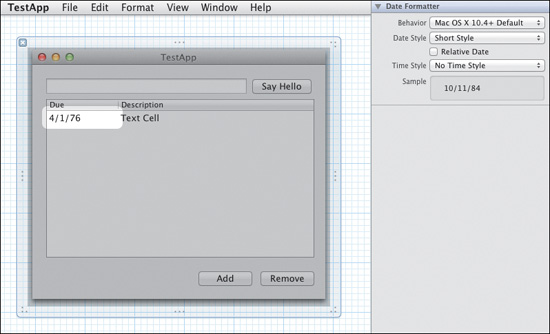
Tip
Prior to Xcode 4, formatters attached to a column’s cell were indicated in the editor with a small “medallion” beneath the cell. Clicking this would let you edit the formatter’s settings. Presently, the only way to get to this setting is to expand the Interface Builder dock or use the Jump Bar to drill down through the window and view hierarchy to the table column’s text cell. The formatter is found under the cell to which it is attached, and selecting it reveals its settings.
Creating the Controller
Core Data works well with another Cocoa mechanism called Cocoa Bindings. The Cocoa Bindings controller layer provides several easy-to-use controllers (such as NSArrayController) that simplify displaying and managing Core Data information. Locate and drag an NSArrayController into the Interface Builder dock (Figure 10.10). Select the array controller in the dock, then select the Attributes inspector in the Utility panel. (Note: Controllers are dragged into the Interface Builder dock because they’re not visual user interface elements.)
Figure 10.10 Adding an array controller
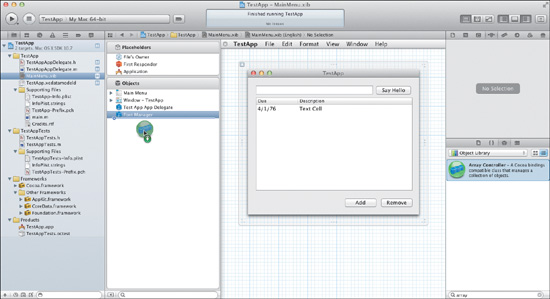
Select the Auto Rearrange Content check box so that newly created to-do items are properly sorted. Change the Mode pop-up to Entity Name. Change the Entity Name field to ToDoItem to tell the array controller it is managing the ToDoItem entity from the MOM. Select the Prepares Content check box to avoid having to manually fetch its contents. The Attributes inspector should look like Figure 10.11.
Figure 10.11 The array controller attribute settings
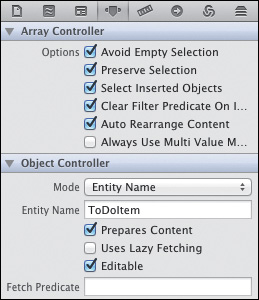
Next you’ll need to bind the array controller to its contents, which come from the Core Data persistent store. Select the Bindings inspector and expand the Managed Object Context binding. Select the Bind To check box and select Test App App Delegate from the pop-up menu next to it. Set the Model Key Path field to managedObjectContext. The Bindings inspector should look like Figure 10.12. This will cause the array controller to use the managed object context (MOC) from the TestAppAppDelegate class (via its -managedObjectContext method).
Figure 10.12 The array controller bindings settings
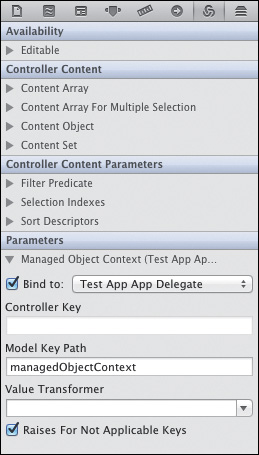
Wiring Up the UI
To finish the interface, you’ll need to wire the controls to the array controller so the to-do items are shown and editable in the table and the Add and Remove buttons work.
First, connect the Add and Remove buttons’ actions to the array controller’s -add: and -remove: actions, respectively. As you learned in Chapter 5, you can do this by Control-dragging a connection from the buttons to the array controller in the Placeholders and Objects panel and choosing the appropriate action.
Lastly, you’ll need to bind the table columns to the content of the array controller. This will let each column represent the corresponding attribute (the due date and content string) of each instance of ToDoItem the table represents (one item per row). Select the Bindings inspector in the Utility area if it’s not already selected. Select the Due column (it will take several clicks on the column to descend through the window and view hierarchy). Expand the Value binding and select the Bind To check box. Select Array Controller in the pop-up. Set the Model Key Path field to dueDate (Figure 10.13). Do the same for the Description column, using content for the Model Key Path field.
Figure 10.13 The Due column’s bindings settings
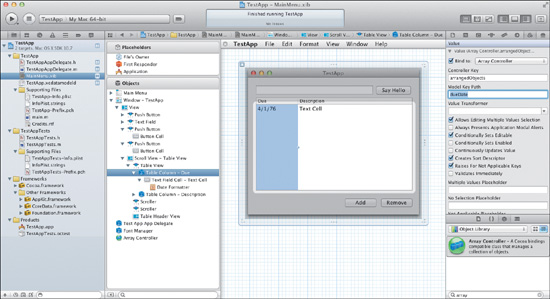
Taking the UI for a Test-Drive
TestApp is ready for a test-drive. Build and run the application. Click the Add button to add a to-do item. Set a date (using the M/D/YY format you chose in the formatter’s attributes) and a description. Quit the application and relaunch. You’ll notice that the changes were automatically persisted. Now try sorting the table by clicking either of the column headers, and then try removing an item. Figure 10.14 shows TestApp in action.
Figure 10.14 TestApp with its new to-do feature
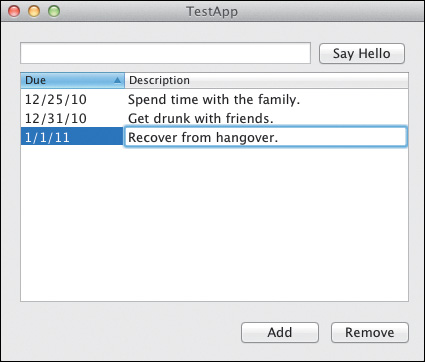
It’s just as easy to add another attribute to the ToDoItem entity. To-dos need a completion check box. To do this, you could add a completed Boolean attribute to the ToDoItem entity and add another table column with a check box cell.
Creating Custom Classes
It’s often necessary to create a custom NSManagedObject subclass to customize an entity instance’s behavior. The class behind an entity must be specified in the managed object model.
To create a subclass for an entity, select the entity in the editor and choose File > New > New File from the main menu. In the sheet that appears, choose the Core Data category and select the NSManagedObject Subclass option. Click Next. You’ll be prompted to choose the folder and group (but not the filename) under which to store the new class. Click Create to complete the action. The new file will be created and added to your project, and the selected entity’s class will be reflected in the Utility area of the Data Model inspector.
To point an entity at an existing NSManagedObject subclass in your project, select the entity in the editor and open the Utility area. Select the Data Model inspector, and change the Class field to reflect the name of the desired class.
Creating Accessors Quickly
When using custom NSManagedObject subclasses, you can generate accessor source code automatically for the attributes of your entities. To do so, select the entity and then select one or more attributes. Choose Edit > Copy from the main menu. You can either select the custom NSManagedObject subclass in the Project navigator or use the Assistant (discussed in the next section) so that the implementation for the subclass is visible. Place the cursor at the point in the source file where you want the accessors to be inserted, and then choose Edit > Paste Attribute Implementation. Xcode will generate and insert valid accessor code in the desired location. You can repeat the process for the header file (the menu item will be Paste Attribute Interface in this case).
Using the Assistant
When editing a data model, additional Assistant behaviors are revealed. In this case, the Assistant shows only source code files that are associated with (or hold references to) custom NSManagedObject subclasses defined in your workspace and used in your managed object model.
Automatic behavior shows the files that Xcode considers to be the best choice for the data model or the selected entity.
Runtime Classes behavior shows all custom NSManagedObject subclasses defined in your workspace that are used by your managed object model.
References behavior shows any files containing references to any NSManagedObject subclasses defined in your workspace that are used by your managed object model.
Wrapping Up
Core Data and Cocoa Bindings are a complex set of Cocoa topics. You’ve only scratched the surface of creating a very simple data model and accompanying UI with Xcode. In the next chapter, you’ll learn how to give TestApp a custom icon.
11. Customizing the Application Icon
Both Mac OS and iOS use the same icon file format (.icns). Icon files are used primarily for application and document icons but can be used as standard images in your application like any other image format. In this chapter, you’ll learn how to use the Xcode Tools utility application Icon Composer to turn your artwork into icon files, as well as how to use these icons in your application.
Picking the Ideal Artwork
The ideal artwork for a Mac OS or iOS icon is a PNG (.png) or TIFF (.tif) image. The image should use transparency to let the background show through “empty” areas of your design. You should also have a version of the artwork in 512×512, 256×256, 128×128, 64×64, 32×32, and 16×16 sizes, each with an appropriate amount of detail for its given size. Though it takes more effort, this multisize approach helps the operating system maintain a crisp image no matter the size of the icon when displayed.
For the examples in this chapter, I’ve created a simple piece of artwork that communicates the “test” nature of TestApp.

Creating Icons
The Icon Composer application (found in the same folder as Xcode, under the Utilities subfolder) takes your artwork and generates an .icns file. Launch this application, and you’ll be presented with an empty document with a series of wells (one for each of the sizes listed in the previous section).
Creating the Icon Document
Drag your artwork into each of these wells. This would be the point where you drag the appropriately sized artwork into the matching well if your graphic designer has created icons with varying detail for each size. Otherwise, just drag the largest copy of the artwork you have into each well (Figure 11.1).
Figure 11.1 A filled-in Icon Composer document
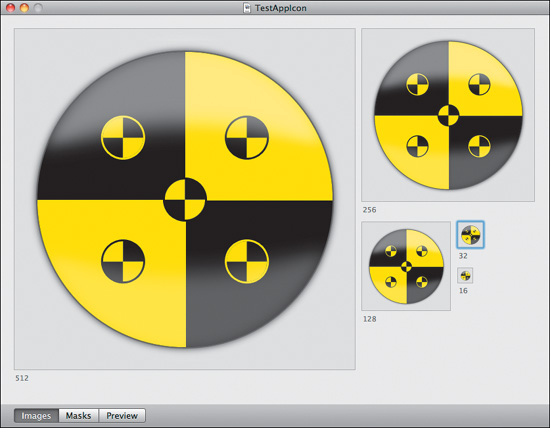
Testing and Verifying the Icon
Icon Composer provides a way to examine your icon at various sizes against various backgrounds. This allows you to make sure the drop shadow and alpha transparency look correct, and it shows how fine details appear when the icon is sized too small for such detail to survive (Figure 11.2).
Figure 11.2 The new icon downsized against a desktop background image
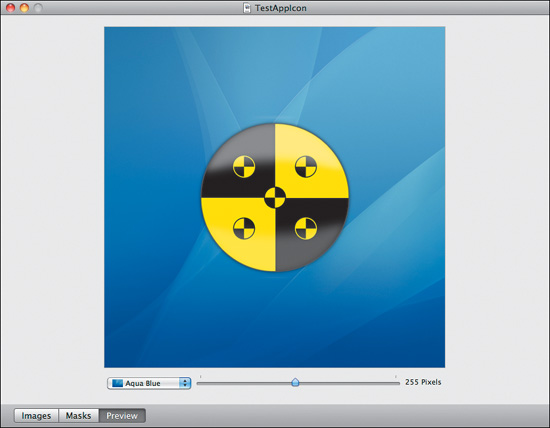
To use this feature, click the Preview button along the bottom edge of the icon document. You can then manipulate the pop-up to choose a background, and the slider to vary the size of the document.
Saving the Icon
When you’re satisfied, save your document icon somewhere sensible. Give it a name such as TestAppIcon.icns. You can now use it to set your application’s icon using Xcode.
Setting the Application Icon
Switch to the TestApp project in Xcode, and select the main TestApp project item at the top of the Project navigator. Under the Targets list, you should see the TestApp target. Select the TestApp target, and your project window should look like Figure 11.3. The App Icon image well claims “No image specified.”
Figure 11.3 The TestApp target editor with no application icon
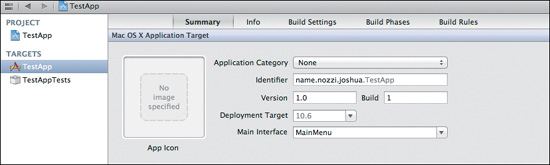
Note
You will further explore configuring a target in Chapter 14.
To set the application icon, drag the icon file from wherever you saved it and drop it onto the App Icon image well. Because the icon file will become part of the project, you will be prompted to add it with the Add Files sheet you encountered in Chapter 6. Leave the Add Files sheet’s default options and click Finish. The icon will appear in the image well and the file is added to the Project navigator. Since Xcode puts it at the root level of the project, now is a good time to file it properly by dragging it into the Resources folder of the Project navigator.
You can now run the program. Note that the new icon appears in the Dock. You can also choose About > About TestApp from the main menu to see the About panel. It should look like Figure 11.4.
Figure 11.4 TestApp’s About panel showing the new icon
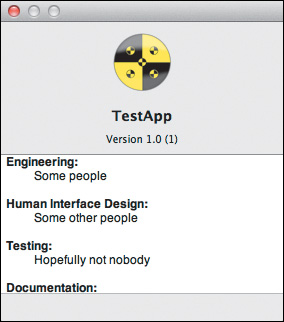
Setting Document Icons
When working with document-based Cocoa applications, you’ll need to add document types (covered in Chapter 14) that the application recognizes. Setting a document type’s icon is just as easy as setting its application icon.
After selecting the target as you did in the previous section, click the Info tab at the top of the editor. Expand the desired document type (or add one; again, see Chapter 14) and note the image well similar to the App Icon well (Figure 11.5). Drag the desired .icns file into the well, and let Xcode add the file to the project. Documents of this type will use this icon when created or edited with your application.
Figure 11.5 A custom document type
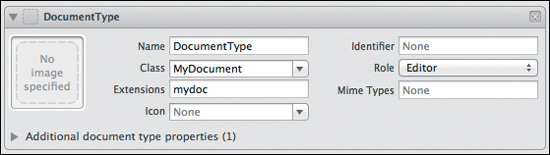
Wrapping Up
In this brief chapter, you learned the simple process behind creating and using icons. This is often one of the final touches before deploying an application. In the next chapter, you’ll learn how to configure Xcode to build a deployment-ready application.
12. Deploying an Application
To deploy an application, you must build it in Release mode. Whether you’re turning the application over to an employer, selling it on your own Web site, submitting it to Apple’s App Store, or just sharing it with a friend, your application must be built for release. In Xcode 4, this is accomplished most directly with the Archive action.
Archiving
In previous versions of Xcode, you would switch between Debug and Release modes and then build the application for that mode. Xcode 4 introduces the Archive action, which automatically builds in Release mode and packages the build target along with its dSYM files (containing separate debugging information for analyzing release-built applications) into an archive file.
Creating the Archive
Open the TestApp project if it’s not already open. To perform the Archive action, choose Product > Archive from the main menu. Xcode will build in Release mode and then archive any built products that are part of your project or workspace in addition to their corresponding dSYM files.
Finding the Archive
The archives of any given project are stored in the default Archives folder Xcode creates. The default folder is ~/Library/Developer/Xcode/Archives. You can change this and other locations in the Locations panel of Xcode’s preferences (Figure 12.1). Archives are stored at the path labeled Archives Location. You can click the arrow button to the right of the path to open the folder in the Finder. Archives are organized by date (under folders named in YYYY-MM-DD format) and then by project name.
Figure 12.1 The Locations preferences panel
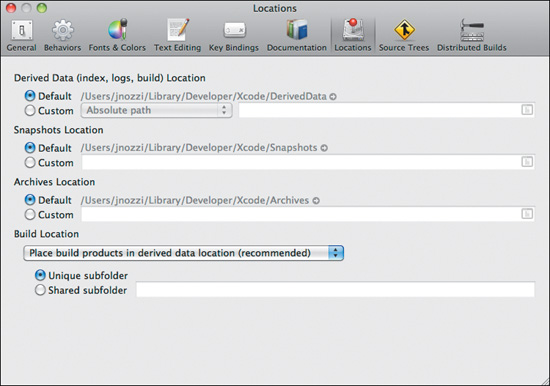
The Archives tab of the Organizer (Figure 12.2) serves as a collection point and browser for the archives you create. Using the Organizer, you can annotate the archives as well as share them with others or submit them to the App Store. To open the Organizer, click the Organizer button in the toolbar or choose Window > Organizer from the main menu. When the Organizer window appears, select the Archives tab.
Figure 12.2 The TestApp archive in the Organizer
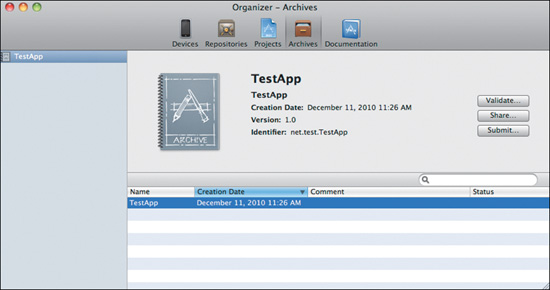

Examining the Archive
Currently the only available archive format is the Xcode Archive (.xcarchive) format. An Xcode archive file is a package (a folder that appears to be a single file). This means you can view its contents in the Finder as well. To do this, right-click (or Control-click) the archive file and choose Show Package Contents from the context menu.

Inside you’ll see the dSYM folder, the Products folder (where the built application resides), and an Info.plist file. The .plist (property list) file, which can be opened in Xcode’s Property List Editor (Figure 12.3), contains a description of the package’s contents.
Figure 12.3 The Info.plist file in the Property List Editor
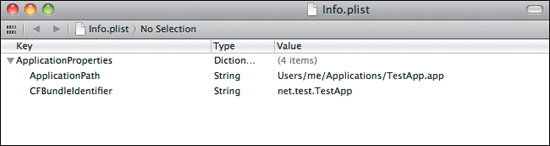
To find the application (TestApp.app), navigate through the Products folder. The products are placed in a folder structure mirroring that of the Installation Directory build setting for the target (see Chapter 14). When you get to the end of the trail of folders, you should see the TestApp application bundle, along with the icon you added to it in Chapter 11 (Figure 12.4).
Figure 12.4 The TestApp.app bundle in the Xcode archive file
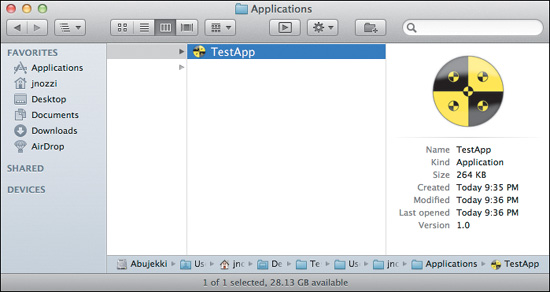
Testing the Application
A lot can be said on the subject of thoroughly testing an application before deployment, but that is beyond the scope of this book (except unit tests, which are covered in Chapter 18). For now, you can verify that the application launches and performs the functionality you added in previous chapters. When you’re satisfied that TestApp says hello when asked and properly manages, saves, and loads a list of task items, quit the application.
Sharing the Application
Use the Share button in the Organizer’s Archive tab to let Xcode help you share the application with others by saving it to a readily accessible location. Alternatively, you can navigate to the application itself and create a zip file with it. To do this, right-click (or Control-click) the application and choose Compress “TestApp” from the context menu. A zip file will be created, which you can easily transmit.
Tip
Zipping any package or bundle, including .xcarchive and .app files, is a good idea since most e-mail systems and many file systems can mangle them.
Submitting to the App Store
To submit to the App Store, you must first have signed up for one of Apple’s developer programs and have provided Apple with the required information for eligibility to sell products in the store. Contact the Apple Developer Relations department if you’re unsure about your status.
Before submitting, you’ll need to validate the app. Validation is a series of tests Xcode 4 runs as a simple way of helping make sure your application isn’t doing something or using code and resources Apple does not approve of. It’s wise to perform this step prior to submission. To validate the app, click the Validate button in the Organizer’s Archive tab and follow any instructions it gives.
Once you’re satisfied, click the Submit button to submit the application to the App Store for review and (ideally) eventual acceptance.
Alternatives to Archiving
Although the Archive action makes App Store submission easier, it makes getting at your built application to package it for other purposes slightly less convenient. Independent Mac developers, for example, have their own staged archive folders into which they dump the latest release build. This folder may include a “quick start guide” in PDF format, a .webloc (web location file) shortcut to their site, and other marketing goodies. This folder is archived as a zip file or disk image to form a user-friendly downloadable.
Xcode 4’s Archive action does not currently provide enough options to support this level of customization. Until the Archive action is built up with more options, the best workaround for independent developers is to create your own scheme to perform all of this staging with your own custom packaging and accoutrements. Alternatively, you can add minimal convenience in the form of a script at the end of the Archive action, which opens the built product’s enclosing folder within the archive in a Finder window.
All is not lost, however. An important set of environment variables was added to Xcode’s build system that can be used within build scripts to manipulate aspects of the build environment. These are ARCHIVE_PATH, ARCHIVE_PRODUCTS_PATH, and ARCHIVE_DSYMS_PATH. Arguably ARCHIVE_PRODUCTS_PATH is the most important, since it makes it relatively easy to extend the Archive action to build your own custom archives alongside those that Xcode curates.
See Chapter 14 for an overview of the new Schemes system. For more ideas regarding how to customize the build process to perform extra tasks, see Chapter 19.
Wrapping Up
In this brief chapter, you learned how to create a release build of your application and archive it for sharing or App Store submission. You also learned there are alternatives for further customization and that Xcode’s Archive action certainly leaves plenty of room for improvement. You’ll revisit the topic of alternatives in Chapter 14. In the next chapter, you’ll discover some more features available to you in the Source Editor.
Part III: Going Beyond the Basics
13. Advanced Editing
In Chapter 7, you explored the Source Editor and some of its features. In this chapter, you’ll explore a few more powerful features and familiarize yourself with some additional tips and tricks to make better use of the editor.
Renaming Symbols
The Edit All in Scope command is a simple and often overlooked editor feature. As its name suggests, you can edit a symbol name and automatically change each instance of it within the current scope at the same time.
Consider a local variable named bob. You’ve decided a variable should sound more formal, so you want to change bob to robert. Assuming bob is reused throughout the current scope of a long method, it would be tedious and error-prone to find and rename each instance, even though they’re temporarily underlined when one instance is selected. To formalize bob, you can click the symbol, placing the insertion point somewhere inside its text. All instances of bob within the current scope then appear with a dotted underline (Figure 13.1).
Figure 13.1 All instances of the symbol bob underlined

If you hover your mouse pointer over any highlighted bob, you’ll notice a button appears immediately to its right. Click this button to open a context menu, and select Edit All in Scope. Xcode responds by highlighting each bob in the current scope, ready to edit them all. Begin typing to replace the text, or move the cursor around within the highlighted text to modify it. In this example, every instance of bob has been renamed to robert (Figure 13.2).
Figure 13.2 In the current scope, bob is now robert.


Click to place the text insertion point somewhere outside the symbol to end editing. Note that only the symbol name changed. It remains a pointer to the string literal @”Bob”. You could further edit the symbol to give robert a sex change. Repeat the procedure, but instead of replacing the text, place the cursor after the t in robert and then add an a. The symbol should now be roberta, who is suddenly in need of a new wardrobe or at least a new string literal.
It’s important to note that this operation works only within the current scope. You cannot use this feature to rename an instance variable or a method.
Refactoring
The programming term refactor is perhaps overused but in general means to “repurpose” or “reengineer” code or even architecture. Xcode’s Refactor function allows you to modify code in an intelligent way.
In the previous section, you learned how to rename symbols within a given scope. The Edit All in Scope function is a more surgical approach than a blind search and replace, since replacing all instances of the common iterator i, for example, would likely make a mess of anything containing the letter i. Still, renaming symbols is limited to the current scope, so you cannot rename an instance variable.
The Refactor function goes a step beyond Edit All in Scope, using its knowledge of your code base to make more intelligent decisions about your code, simplifying common but error-prone refactoring tasks.
Refactoring Options
You can find the various types of refactoring Xcode can automate for you in the Edit > Refactor menu.
Rename
Rename works in much the same way as Rename Symbols, with one exception: It is not limited to scope. This distinction means you can rename an instance variable. In the case of an Interface Builder outlet, Rename will update the outlet in your xib as well (a huge time-saver). In the case of a class, filenames themselves can also be automatically changed to match.
Extract
Extract takes a selected block of code and creates a method or function (depending on your choice) with it. If the code block depends on local variables, they will be converted to arguments of the method or function.
Create Superclass
Create Superclass does just as the name suggests—it creates a superclass from the selected class. You can choose to place the declaration and implementation in the selected class’s files or in their own new files.
Move Up/Move Down
Move Up takes the declaration and implementation of the selected item and moves them to a superclass. Move Down moves the selection to one or more subclasses of the current class.
Encapsulate
Encapsulate creates accessor methods (getters and setters) for a selected instance variable and changes all direct references to them so the accessors are used instead.
Modernize Loop
Modernize Loop converts while or C-style for loops to Objective-C 2.0 for loops.
Convert to Objective-C 2.0
Convert to Objective-C 2.0 modifies the code in the selected source files to take advantage of Objective-C 2.0 features. This includes modernizing loops and converting accessor methods to properties and synthesized accessors.
Using Refactor
To familiarize yourself with the Refactor feature, you can rename the NSTextField outlet you created in Chapter 5 from textField to a more descriptive helloTextField. To begin, open the TestApp project and navigate to the TestAppAppDelegate.m file. Double-click the textField symbol on line 13, and select Edit > Refactor > Rename from the main menu. A sheet will appear similar to Figure 13.3.
Figure 13.3 The Rename sheet
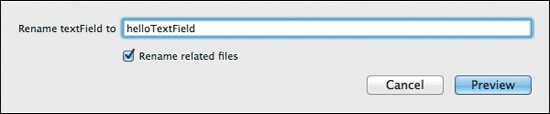
Change the name to helloTextField, and click Preview. Xcode will present a preview sheet similar to Figure 13.4 and analyze your project to locate all references to the symbol. You can use the Rename preview sheet to verify and cherry-pick individual replacements.
Figure 13.4 The Rename preview sheet
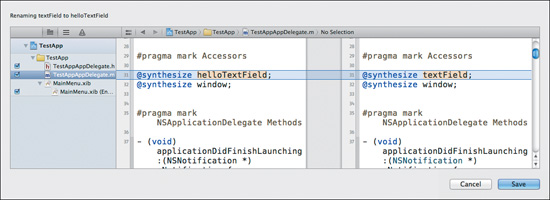
You can use the list on the left side of the window to jump directly to each instance that will be renamed. Each item has a check box that lets you choose whether that file will be included in the renaming changes. In this case, there are three files that will be modified: TestAppAppDelegate.h, TestAppAppDelegate.m, and the English version of MainMenu.xib. The right pane shows two versions (“before” and “after”) of the selected file. If you select TestAppAppDelegate.m in the list, you’ll notice two red tick marks in the track of the scroll bar. These indicate the places within the file where the symbol is referenced or defined (where changes will be made). Click Save to make the changes.
If you examine all three files (right-click the text field in the xib to examine its referencing outlets), you’ll notice the change has been applied. You should now be able to build and run the application to test it. Click the Say Hello button to make sure the greeting still appears in the renamed field.
The process is similar for each of the available Refactor actions. Though the preview sheet works the same, the initial sheet (shown in Figure 13.3) will contain the various options available for each action.
Tip
Not all refactoring actions can be carried out without your intervention. The Issues button above the change list can be used to explore any problems that Refactor anticipates with performing the proposed action.
Organizing with Macros
Xcode includes CPP, the C preprocessor, through which your code is run just prior to compilation. The preprocessor transforms your code wherever macros are encountered. For example, when it encounters an #import directive, the preprocessor replaces it with the referenced file (nearly always a header file) so its contents are available to the compiler.
A less obvious use of preprocessor macros is for organization within a graphical editor. Using the #pragma mark directive, you can define areas within your source file. When you have this file open in the Source Editor, the last segment of the Jump Bar (which, as you’ll recall, lists class members for easy navigation) will reflect your marks by grouping them in its pop-up menu. For example, Figure 13.5 shows one possible organization of the TestAppAppDelegate.m file.
Figure 13.5 The Jump Bar pop-up organized using #pragma mark
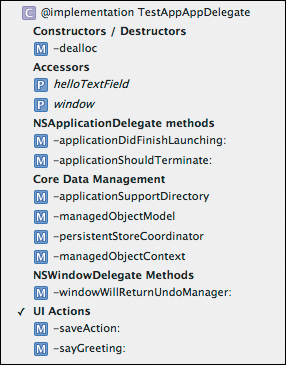
To use the directive, just place it (along with a name for the section) on a blank line by itself as follows:
#pragma mark Constructors / Destructors
You can go a step further and place a separating line in the menu by using a dash as the mark as follows:
#pragma mark –
There is no defined standard dictating how you should use this directive, nor does it have any effect on your compiled code (it is not part of the compiled code). Although it’s easy to get carried away and pepper your code with marks, most take a minimalist approach and group methods by their primary function.
As an example, you might create a section for UI actions in a controller class, another section for model manipulation methods, another for initialization and deallocation, and another still for accessors. Figure 13.5 roughly follows this general approach. Your style may vary.
Changing Editor Key Bindings
Although the focus of the Key Bindings preferences panel (Figure 13.6) is not limited to the Source Editor, it’s worth pointing out that you can customize even the most basic Mac OS text editing and navigating keyboard shortcuts in Xcode 4. Developers familiar with the shortcuts of other environments will find this invaluable.
Figure 13.6 The Key Bindings preferences panel
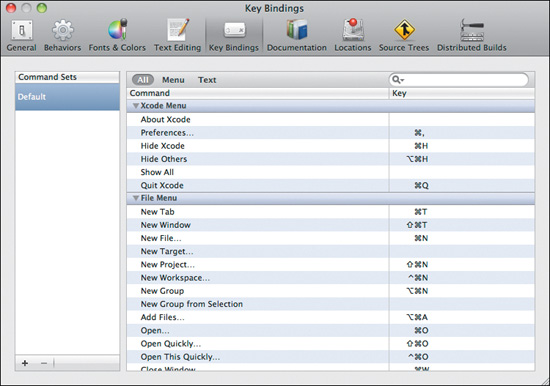
To open the Key Bindings preferences panel, choose Xcode > Preferences from the main menu and then select Key Bindings from the toolbar. The left side of the panel provides controls for managing command sets you create or customize. The right side lets you locate and customize shortcuts.
The shortcuts are grouped by function in the list. You can filter the list using the search bar at the top. To the left of the search bar, you can choose to show only menu- or text-editing shortcuts.
Note
The shortcuts for most any item in Xcode’s menu can be customized (or added if none yet exist). The list of customizable shortcuts is quite extensive and worth a few minutes of your time to browse.
Managing Command Sets
You can think of command sets as “keyboard shortcut profiles.” For example, if you were nostalgic (or stubborn), you could create a command set whose text shortcuts match those of Vim or CodeWarrior.
Use the + and - buttons at the bottom of the list to create or remove command sets. Although not really obvious, the currently selected command set is the one currently in effect and is persistent. To switch to a different command set, just select it.
Customizing Shortcuts
To customize a shortcut, double-click the field in the Key column next to the shortcut. The field will become highlighted, and + and - buttons will appear near its right side. The - button removes a shortcut, and the + button lets you add shortcuts (so multiple shortcuts can fire the same action). To set a shortcut, press the key combination you’d like and then click outside the field to end editing (or press the + button to add another).
Jump to Definition
The Source Editor hides a simple navigational shortcut you won’t be able to live without once you know it’s there. Although not strictly an editing feature, the need to navigate to the definition of a symbol (possibly one of many) while writing your code is common. Xcode makes this simple. Hold down the Command key and hover the mouse pointer over any symbol to turn the symbol into a hyperlink. Click the link (while still holding down Command) to navigate to the symbol’s definition (or implementation). When multiple definitions exist for the clicked symbol, a pop-up similar to Figure 13.7 appears, listing all known definitions of the symbol (and the file and line number where each appears). Select any definition to navigate to it.
Figure 13.7 Various definitions of a symbol in the Jump to Definition pop-up
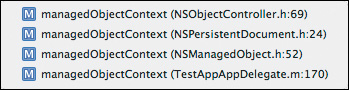
My Company Name
Very few developers are likely to work for a company called “My Company Name,” yet Xcode insists on inserting this in the copyright block at the top of any source files it creates. If you’re not currently employed by My Company Name, it’s wise to change the Organization field associated with the project so the copyright of newly created files reflects your actual organization (or even just your name).
To do this, select the project itself (the top-level object) in the Project navigator; then open the Utility area and select the File Inspector pane. Under the Project Document section, type the name of the desired copyright holder in the Organization field. Any source files Xcode creates from that point forward will insert that name instead of the standard __My Company Name__ placeholder.
Wrapping Up
This gentle introduction to the more advanced (or simply less common) aspects of Xcode 4 has given you a handful of powerful Source Editor features. These features offer elegant solutions to tedious and error-prone editing tasks developers encounter often when writing or maintaining code.
In the next chapter, you’ll learn about Xcode 4’s new Schemes system and how to customize the build and archive process, set up target dependencies, and more.
14. The Build System
Xcode 4 offers an overhauled user interface for its build system that de-emphasizes switching between separate build configurations for Debug and Release and focuses more on what developers spend most of their time doing within the IDE: coding and debugging.
Developers are meant to handle release builds with the Archive action. The Archive action in version 4.0 is heavily biased toward the preparation of a release build for sale in Apple’s App Store. Fortunately, the new build system UI is flexible enough to offer the full functionality with which veterans are familiar. There is nothing preventing you from creating a build scheme that generates a release build and bypasses the Archive action entirely.
An Overview
Let’s take a brief tour of the terminology before exploring each term in depth. The end result of a build is some sort of product—an application, a plug-in, a command-line program, a framework, or a library.
Targets
A target describes a product (an application, a plug-in, a library, a unit testing bundle, or an aggregate of other targets) to be built and the instructions for building it. The instructions specify source code and resource files within the project, build settings, phases, and rules. A project might contain more than one target. For example, a project might contain targets for a desktop application, a companion command-line program, and a library of shared code used by both. A target can also specify another target and a script to run, giving you the ability to create a “deployment package” target.
Schemes
A scheme describes one or more targets to build, a configuration to use when building them, custom build scripts to execute before and after a given action, and tests to execute against the target (see Chapter 18). A project will have at least one scheme but can contain as many as you need. A scheme can be shared with others who use the project or workspace and can be exported for use in other, unrelated projects to save the trouble of re-establishing settings used commonly in your organization. Xcode will also create new schemes as you add targets (a feature that can be disabled in the Manage Schemes sheet). Schemes (and a corresponding run destination) are selected when building and running applications in order to specify which target and dependencies to build with what configuration, and in what environment to run the built product.
Build Settings
Build settings include the target architecture and SDK, the location of intermediate build files, compiler selection (LLVM versus GCC, for example), linker settings, search paths, and more. The settings can be project-wide or target-specific, and a separate value can be defined for a given configuration (Debug versus Release, for example).
Configurations
A configuration describes a collection of build settings for the build environment. By default, an Xcode project has two configurations: Debug and Release. The configuration Xcode uses when performing a given action (such as Run, Analyze, or Archive) is dictated by the settings in the active scheme. For example, the Run action of the default scheme of a Cocoa application project would use the Debug configuration, while the Archive action would use the Release configuration. Common configurations can be exported and imported to enable sharing and reuse between an organization’s projects.
Run Destinations
A run destination describes the environment in which to run an executable product (that is, a target that specifies an application or command-line program). The environment can be your Mac (in 32-bit or 64-bit mode), the iOS Simulator, or an actual iOS device. The available run destinations shown in the Scheme controls are determined automatically by the build settings specified for the associated target—specifically, the combination of settings specified in the Supported Platforms, Architectures, and Base SDK build settings.
Build Phases
A build phase is a stage in the build process of the current target (build dependencies, compile, link, copy resources, run a postprocessing script, and so on). In addition to the standard compile, link, and dependencies phases, you can add phases to a target, such as Copy Files or Run Script. This can be a simple way of adding the additional step to the target’s build process, such as copying an embedded framework into an application bundle. It can also provide a hook for more-complex manipulations during the build process using shell scripts. See Chapter 19 for more details regarding customizing the build process.
Build Rules
A build rule defines associations between a type of file (such as a C or Objective-C source file) and the program used to compile or process it. The default build rules for common file types are target-independent, but you can define target-specific rules as well. You might define a custom build rule for a new file type Xcode does not know how to handle or to specify an alternative tool to use (or the same tool with different arguments) when handling that file type.
Working with Targets
Since a target represents a built product (or an aggregate of other targets), it’s an “end result” of your coding efforts. Xcode 4 provides template targets for the most common types of target, such as Mac or iOS applications, command line programs, frameworks, and so on (Figure 14.1).
Figure 14.1 The target template chooser
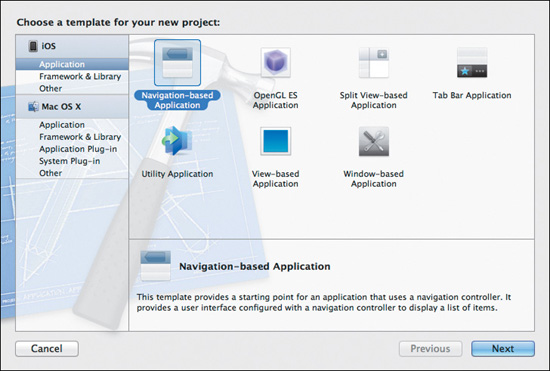
Numerous other target templates exist for less common tasks as well. These include system plug-ins for Spotlight importers, screen savers, device drivers, and others (Figure 14.2). Templates exist for specific applications bundled with the Mac OS as well, including Address Book, Automator, and WebKit.
Figure 14.2 Other target types
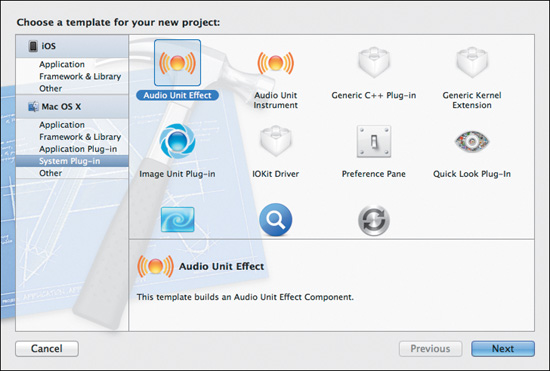
Finding Your Project’s Targets
When you create a new Xcode project, an initial target is created and configured for you, sharing the name you specified for your project. You can find every project’s targets by selecting the project itself in the Project navigator (Figure 14.3). You’ll recall the target view in Figure 14.3 (the result of selecting the TestApp target in the Targets list) from Chapter 11.
Figure 14.3 Selecting a project’s target
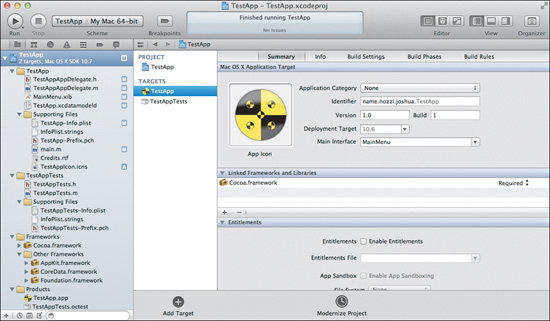
Note the other target in the list: TestAppTests. This particular target produces a .octest bundle, which Xcode uses to run unit tests (see Chapter 18). Note the different icon—a building block signifying a plug-in bundle.
Project-Wide Settings
Selecting the TestApp project under the Project group reveals project-wide settings. These settings serve as the “global” settings used by the targets defined within it.
The Info tab reveals three main groups: Deployment Target, Configurations, and Localizations.
The Deployment Target group currently holds only one setting (depending on the platform—Mac OS or iOS): the minimum OS version for which your project’s targets are built.
The Configurations group lets you define the configurations available to your targets. As mentioned at the beginning of the chapter, Xcode creates Debug and Release configurations (and appropriate build settings for each) by default. Here you can add, rename, or remove configurations as desired. At the bottom of this group is an option to specify which configuration command-line builds use when builds are initiated using Xcode’s command-line interface (which is beyond the scope of this book).
The Localizations group lets you specify to which languages your Cocoa applications are localized, which helps you automatically manage the individual copies of user interface and other resource files that are specific to a language. Localization is also beyond the scope of this book.
Exploring a Target
Application targets (a standard Mac or iOS Cocoa application bundle) have the most settings, so the TestApp target is a good one to explore. Make sure you’ve selected it, as in Figure 14.3. You’ll explore each tab along the top of the editor, starting with the Summary tab.
The Summary Tab
The Summary tab displays the basic information—mostly reflecting the options you chose when you created the project—in the top panel, titled Mac OS X Application Target. The Application Category pop-up menu is used to categorize the application if you plan to sell it in Apple’s App Store. The Identifier field is the canonical name you chose (which should correspond to your organization’s domain name in most cases). The Version number is the string that the Finder and the application’s About panel display for the application. The deployment target specifies the version of Mac OS for which your application is built. The image well, as you learned in Chapter 11, holds the application’s icon (and sets its corresponding configuration entry when a new .icns image is dragged into it).
The next section, Linked Frameworks and Libraries, displays (and lets you edit) the frameworks and libraries to which your application is linked. This affects the Link Binary With Libraries build phase in the Build Phases tab. The Add (+) and Remove (−) buttons let you edit this information directly. Clicking the Add button reveals a searchable list of libraries and frameworks available on your computer from which you can choose (Figure 14.4). You can also choose Add Other from this sheet to locate a library or framework not present in the default locations that Xcode knows to search.
Figure 14.4 Choosing frameworks and libraries against which to link a target
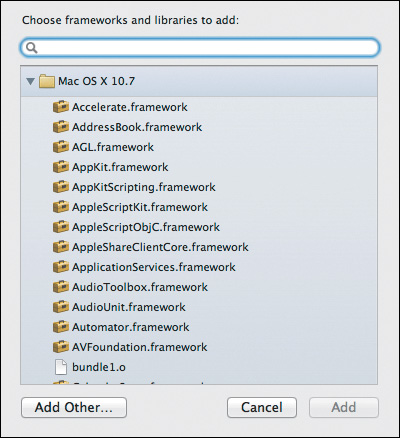
For iOS targets, there are some differences in the Summary tab. In Figure 14.5, you’ll notice a Devices pop-up under the iOS Application Target group. This lets you select whether your project produces an application for iPhone, iPad, or both (a “Universal” application). Under the Deployment Info group, you’ll see options (enabled by pressing them) to specify which orientations your application supports—that is, which directions will your applications follow when the user rotates the device. The App Icons wells work the same way as the App Icon well in a Mac OS target, except the second well (marked Retina Display) holds a high-resolution version of the icon, appropriate for the high-resolution Retina display in newer devices. The Launch Images wells are used to specify the images used at launch time (one for normal resolution and one for high-resolution Retina displays).
Figure 14.5 The Summary tab (for iOS targets)
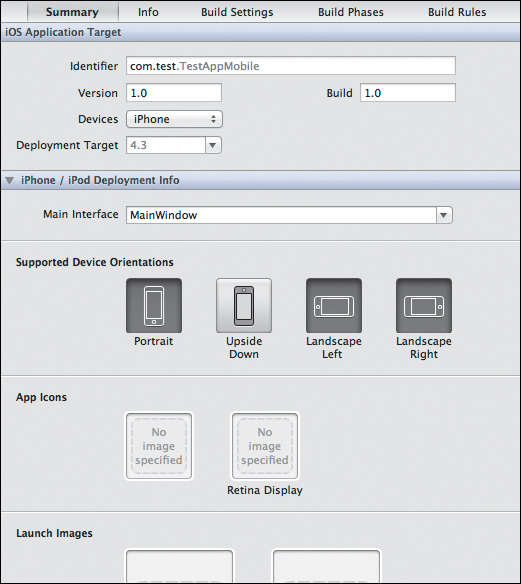
There is one more section, named “Entitlements.” Entitlements are explored in more detail later in this chapter.
The Info Tab
The Info tab (Figure 14.6) lets you edit the information contained in the app bundle’s Info.plist file—the file Cocoa bundles use to describe themselves to the operating system. This file contains some of the information you can manage on the Summary tab, but it’s got a great deal more responsibility.
Figure 14.6 The Info tab
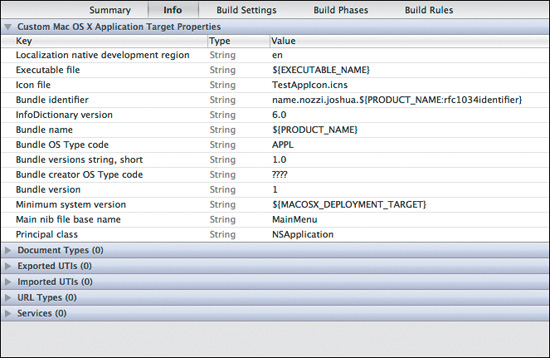
The editor is much like the one used to edit .plist (property list) files. You can see this for yourself by navigating to the TestApp-Info.plist file under the Supporting Files group. You’ll see something similar to Figure 14.7—a simple property list editor. Navigate back to the target’s Info tab, and you’ll see the difference: This particular editor is custom tailored to work with Cocoa bundle property lists and automatically loads the contents (the same as in TestApp-Info.plist) and organizes the interesting parts into sections.
Figure 14.7 The property list editor
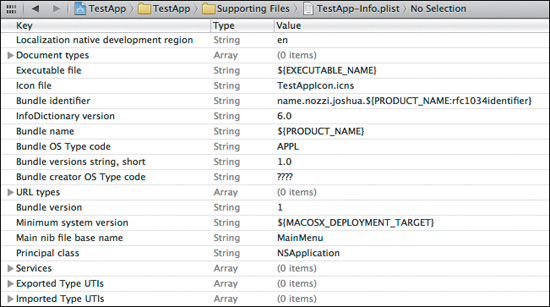
The Custom Mac OS X Application Target Properties section lists all the basic parts of the property list that define your unique application (including version number, the principal class used to load the application, the main nib or xib file to use, and so on). Selecting an individual row reveals more aspects of the editor (Figure 14.8). Each row’s type (the key used to specify its corresponding value) can be edited by clicking the arrows to reveal a list of other available keys (Figure 14.9). Double-clicking a key or value lets you edit each directly. See the “Bundle Structures” section of the Bundle Programming Guide in Apple’s documentation for more information about the keys used and their meaning.
Figure 14.8 More (to the row) than meets the eye

Figure 14.9 Choosing keys
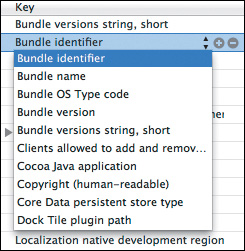
The Document Types section holds any document types defined for your application. Since TestApp is not a document-based application, this section is empty by default. That’s not to say a non-document-based application can’t be given document types that it can recognize and provide viewing or editing capabilities for, however. Figure 14.10 shows an example of what some custom document types might look like.
Figure 14.10 Some example document types
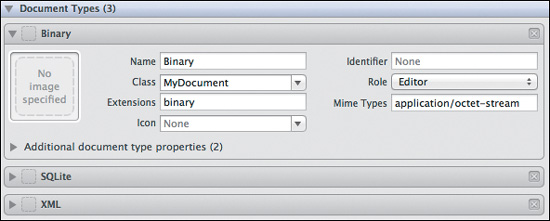
The Exported UTIs and Imported UTIs sections (also empty) let you define any UTIs (Uniform Type Identifiers) your application imports or exports. Defining UTIs here is a way of letting your application “claim” (and provide icons or system services for) a particular data type as well as define new data types and lineage that your application provides. See the Uniform Type Identifiers guide in Apple’s documentation for more information.
The URL Types section allows you to define URL schemes your application understands. An example might be a URL that takes the form of testapptask://taskid and causes your application to be launched and display the task with the specified taskid. See the Launch Services Programming Guide in Apple’s documentation for more information.
The Services section lets you define system services (such as Insert Employee ID Here), which can be accessed from other applications. See the Services Implementation Guide in Apple’s documentation for more information.
The Build Settings Tab
The Build Settings tab (Figure 14.11) contains all the build settings for the selected target, grouped by category. The simplest view, as shown in Figure 14.11, can be seen by setting the filter bar (just beneath the tab bar) to show Basic and Combined. This instructs the editor to show you only the most commonly used settings and only the values for the selected target.
Figure 14.11 The Build Settings tab
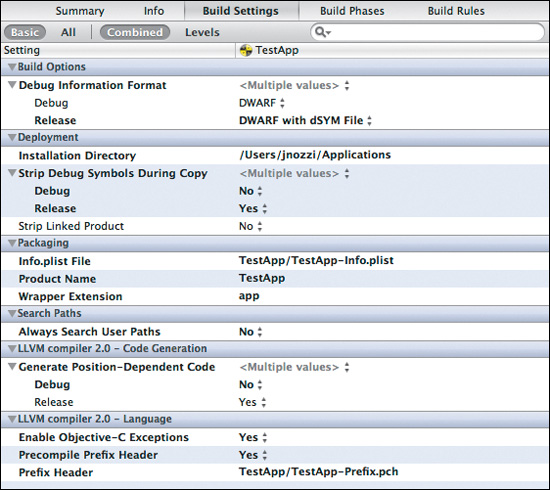
For each setting, you can edit the matching value under the column named after your target. Some values are simple strings while others are presented in a pop-up menu. In cases where you can make more than one selection (such as the Architectures setting), you can select Other from the menu and you’ll be presented with a pop-up window (Figure 14.12) that allows you to add multiple selections. In the figure, an environment variable is used that, to Xcode, means the standard 32/64-bit universal binary.
Figure 14.12 A multiple-selection pop-up window
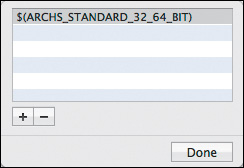
You can also have per-configuration settings. That is, separate settings for Debug versus Release configurations (or any others you define). In Figure 14.13, you see that the Strip Debug Symbols During Copy setting has an open disclosure triangle next to it and has separate settings for the two configurations—Debug and Release. It would be pointless to remove debugging information from a debug build, so the build system will strip debug symbols only from a release build, leaving them intact for debug builds. This is an excellent example of why different configurations (or at least separate settings for debug and release) are necessary. The information is removed from a release version to reduce the size of the executable and to improve performance.
Figure 14.13 A per-configuration setting
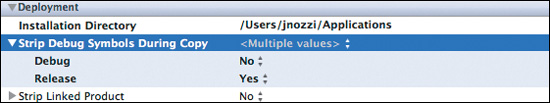
Note
The disclosure control appears only for settings that already have per-configuration values defined.
For projects with multiple targets (or workspaces with multiple projects), you may need finer control than you get by choosing Combined versus Levels in the filter bar. Choosing Levels reveals multiple columns after the Setting column, showing what the settings are for each “level” (Figure 14.14). From right to left, the columns represent global defaults down to project- and target-specific settings.
Figure 14.14 Build settings arranged by level
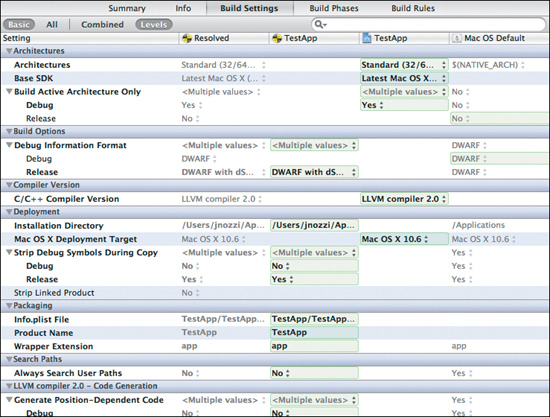
Starting from the right and working to the left, you see the default settings for the platform (Mac OS Default). These settings cannot be edited because they are the same for every Mac OS target. All levels below this one inherit its settings. Project- and workspace-level settings come next, then target-level settings. The Resolved column shows the final state of all inherited settings for the selected target.
The simplest example of the usefulness of multi-level inherited settings is the Product Name setting (exposed by the Packaging disclosure triangle). Each target produces an application bundle or executable, which must have a name. No two targets are likely to share the same name, so each target would have its own non-inherited name. Of course the product name isn’t specified at the OS or project levels. An example of this can be seen with the Wrapper Extension setting (also in the Packaging settings). An application bundle always gets an extension of .app. Other bundle types would have different extensions. Take a look at the same setting for the TestAppTests target. The Mac OS Default setting is .bundle; at the target level it’s .octest.
When viewing settings arranged by level, settings defined for a given level are outlined in green (also seen in Figure 14.14). You can see this in the Product Name setting. If a value is overridden further down the hierarchy (working toward the left), that value is also outlined in green. This helps you determine the level at which a setting is customized and, when considered with the Resolved column, lets you easily determine the precise setting for your individual targets.
You can also add user-defined build settings by using the Add Build Setting button at the bottom of the editor. This lets you further customize the build process by passing custom settings not shown in the editor. User-defined settings appear at the bottom of the list in a group called User-Defined. For example, you might want to include a “This app is BETA!” user interface element for beta builds. You might add a “Show Beta UI” setting with a value of Yes if building a beta release (using a “Beta Release” configuration you can add to the project’s Configurations), or with a value of No otherwise. You can use the preprocessor to check the value of this setting at compile time and include or exclude your custom “add the beta UI element” code. See Chapter 19 for more information on using similar approaches.
There are many settings in this tab that affect the build environment, the built product, and even what kinds of errors and warnings the build system should respect or ignore. The depth and breadth of these settings is beyond the scope of this book, but it’s worth noting that the Quick Help pane of the Utility area will give you detailed information on each. Just select the setting in the editor and the Quick Help pane will provide an overview of the setting, its options, and its implications.
The Build Phases Tab
The Build Phases tab (Figure 14.15) lets you manage, add, and remove build phases for your target. The available phases depend on the type of target you are building. For example, only bundles can have bundle resources (such as images, sounds, Help Book files, and so on), so the build phase would not be used for a command-line tool.
Figure 14.15 The Build Phases tab
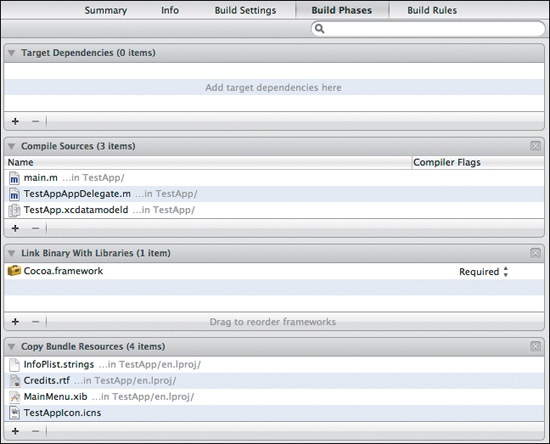
You can add phases using the Add Build Phase button at the bottom of the editor. Those that are removable can be removed by clicking the remove (x) button in the upper-right corner of the phase’s table.
The first build phase—Target Dependencies—is the one phase that cannot be removed. This special phase lets Xcode know of other dependencies (such as a framework or plug-in for an application) that must be built before the currently selected target can be built. This build phase defines implicit dependencies as opposed to allowing Xcode to determine target dependencies automatically as configured in the active scheme. You can add and remove targets (any target except the selected one, for obvious reasons) for this phase using the Add (+) and Remove (−) buttons at the bottom of the phase’s table.
The Compile Sources phase compiles any source files belonging to your target using the appropriate compiler for the file type as defined in the Build Rules. You can set compiler flags (such as optimization settings like -funroll-loops or -O3) for each individual file by double-clicking in this phase’s Compiler Flags column, typing the flags, and then pressing Return. You can add source files to and remove source files from this phase using the Add (+) and Remove (−) buttons at the bottom of the phase’s table. This phase seems like it should not be optional, however if you recall that there can be aggregate targets and other types, you can see why this phase is not always necessary.
The Link Binary With Libraries phase lets you control which libraries your product is linked against using the linker. While it’s true you don’t have to use a library or framework in your source code to make use of it in your application (because it might be used from an instantiated object in your xib), you’ll always have to link against it if you use it at all. By default, all Cocoa applications are linked against the Cocoa framework, which explains the framework’s presence in the TestApp target. When using additional libraries and frameworks, it’s easiest to add them here. You can add and remove linked libraries and frameworks for your product using the Add (+) and Remove (−) buttons at the bottom of the phase’s table. Pressing the Add button reveals the same Frameworks and Libraries sheet you saw in Figure 14.4, from which you can select the library or framework to which to link.
The Copy Bundle Resources phase copies any resources included with your bundle into a ../Contents/Resources folder relative to your bundle’s file path (the standard location for resources in any type of Cocoa bundle). Resources include application and button icons, video and sound clips, template files, and so on. Notice the TestAppIcon.icns file you added to the project in Chapter 11 is included in this phase, ensuring it will be available as a resource to the application at runtime and to the Finder when displaying the application in the file system.
Note
Linking is accomplished using a “linker,” which can be the ld command, evoked by the GCC (GNU Compiler Collection) compiler, or llvm-ld, evoked by the LLVM (Low Level Virtual Machine) compiler.
There are three other types of build phases that you can add to your target using the Add Build Phase button at the bottom of the editor. These phases don’t show up by default for a standard Cocoa application target.
The Copy Files phase (Figure 14.16) lets you identify a path into which to copy the files you specify. You can choose a predefined destination path from the Destination pop-up or specify a custom path. Most often, a Copy Files phase would specify a location within a bundle (the bundle built by the target), but this phase can be used to copy files or even built products to a variety of locations. Predefined paths include a bundle’s Resources or Frameworks folders, the Shared Frameworks system path, and more. It’s not uncommon to have multiple Copy Files build phases in a target. For example, you may specify a framework you either built yourself or are including from a third-party source, and choose to copy it into the application bundle’s Frameworks path so the framework is available to the application at runtime (see Chapter 15). You might also add a Copy PlugIns build phase, with which you can copy a set of built plug-ins included with your main application into the application bundle’s PlugIns folder. The Subpath field lets you append a subpath to whichever path you’ve selected in the Destination pop-up. The “Copy only when installing” check box instructs Xcode to copy the files only when your current scheme’s build settings include the install flag. The Add and Remove buttons work the same way as in the other phases, allowing you to specify the files that are copied to the selected location.
Figure 14.16 The Copy Files build phase
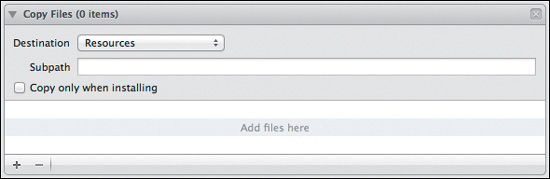
The Run Script phase (Figure 14.17) lets you run any script (by typing in the script editor field or dropping a script file into it). Again, you might have multiple Run Script phases in a given target. The Shell field lets you choose the shell you wish to use (it defaults to sh). Using the check boxes beneath the script field, you can choose whether to show the script’s environment variables in the build log and whether to run the script only when installing. You can specify input files from which your script can pull information, as well as output files into which the script’s results can be placed.
Figure 14.17 The Run Script build phase
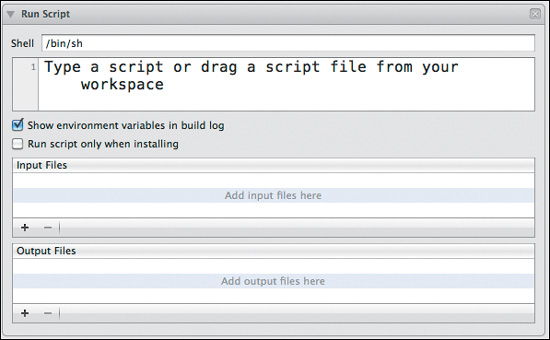
The Copy Headers phase (Figure 14.18) lets you specify header files and their visibility for products such as frameworks, plug-ins, or drivers. The scopes (Public, Private, and Project) determine the visibility of the header in the built product. A public header is included in the product as readable source code; a private header is included in the product but is marked as private so clients know not to use its symbols directly; a project header is not included in the product and is meant to be used only by the project when building the target. The Add and Remove buttons work the same way as in the other phases, but in this case, when you add, you’ll see a sheet similar to Figure 14.4, but which lets you select only header files. Once added, a header will first appear in the Project scope. You can then drag it into Private or Public scope as desired.
Figure 14.18 The Copy Headers build phase
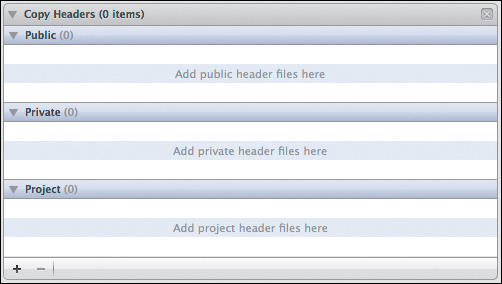
The Build Rules Tab
Xcode maintains a default list of predefined (system) rules that determine which file types are processed by which script or program during the build process. This is found under the Build Rules tab (Figure 14.19). For example, C source files are compiled using GCC System Version (which is LLVM GCC 4.2 in Xcode 4.0). The Build Rules tab lets you customize these rules or define new ones for the selected target.
Figure 14.19 The Build Rules tab
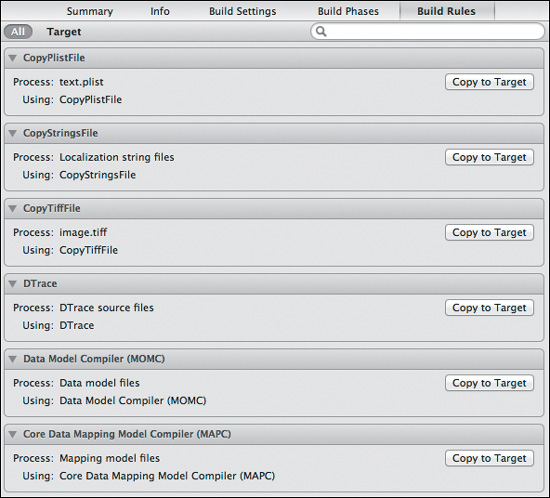
With the filter bar set to All, you see all the default system build rules and any target-defined rules. Set the Build Rules tab’s filter bar to Target to see the rules overridden or defined only for the target (that is, to filter out the default system rules).
To customize a system build rule for a given file type, locate it in the list and click its Copy to Target button. The new custom rule will be added to your target, ready for you to specify the script or predefined program to use to process the file type. You can also add a rule to your target for a file type not covered by the system rules by clicking the Add Build Rule button at the bottom of the editor.
As an example, pretend you want to let Xcode compile some Pascal files (with a .pp extension) and that you have Free Pascal (www.freepascal.org) installed. Figure 14.20 shows a possible rule for this scenario. You could add a build rule (using the Add Build Rule button) and choose “Source files with names matching” from the Process pop-up and specify .pp as the text to match. The Using pop-up could be set to Custom Script, and the script body itself could merely call fpc (the Free Pascal compiler program) with your .pp source file as its argument. Now, for this target, Xcode can recognize and properly compile Pascal source files. While the Pascal rule should not affect your TestApp project (because there are no Pascal files in it), it’s unwise to leave meaningless things in your project. You should remove any added or customized rules from your TestApp target to avoid any unexpected behavior as you follow along for the remainder of the book.
Figure 14.20 A custom build rule showing its .pp
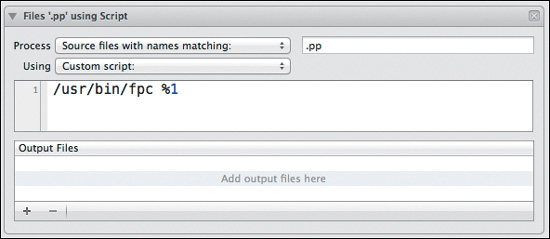
It’s easy to see how much power this simple feature, hidden away as it is, can give you. With this feature, you can teach Xcode how to handle other types of files automatically during the build process.
Adding New Targets
There are several reasons why you might want to add multiple targets to a project. Your application might need a Spotlight plug-in (kept in its bundle’s Resources subfolder so OS X can find it easily). A Spotlight importer plug-in can be kept in a separate project, but it makes more sense to keep it within the same project as its parent application. Therefore, your project might have a separate target to build that plug-in (which would be a dependency of the application’s target and would be included in a Copy Files build phase that copies the built plug-in into the app bundle’s Resources folder when it is built). The same applies to other plug-ins, libraries, bundles, and so on.
Another example might be two separate builds of the same application: a free version and a paid “Pro” version. Both applications might share 95 percent of the source code and resources but differ only in that the Pro version has the ability to access certain features, or in that the free version expires 30 days after its first launch. Or, because of Apple’s App Store policies, you might choose to link against, include, and use your own registration system in one build of your app, while using the App Store receipt validation process in an App-Store-only build.
You might also add a unit test target, which executes unit tests against your code. Unit tests are covered in Chapter 18.
To add a new target, use the Add Target button at the bottom of the editor while a target or project is selected. A sheet appears (Figure 14.21), similar to the one that appears when creating a new project. In the figure, a Spotlight importer target (for teaching the OS X Spotlight searching facility how to index your application’s information) is selected.
Figure 14.21 The target template sheet
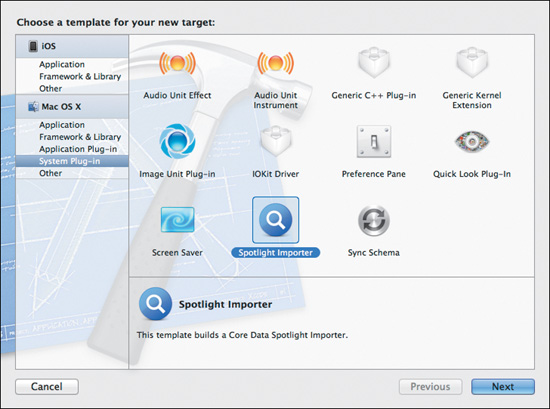
If you were to click Next and continue defining the target to add to your TestApp project, you’d be prompted with much the same line of questioning as when you created the TestApp project (which was necessary to create the TestApp application bundle target). In the case of a Spotlight importer target, you only need to give it a sensible name (such as TestAppImporter) and a company identifier (preferably the same as that of your application). Xcode will add the target to the project’s targets list (complete with build settings appropriate to the target type), create a separate build scheme for the target, and add the necessary source and resources to the project, as seen in Figure 14.22.
Figure 14.22 The new target’s resources
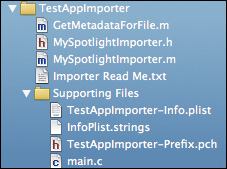
Note
The New Target sheet is similar to the New Project sheet primarily because Xcode needs to know what kind of target (or targets) to add to your newly created project.
Since the importer should be a part of the app, you would need to take a few extra steps for it to become part of TestApp. First, select the app’s target, select the Build Phases tab, and drag the importer target into the Target Dependencies build phase (Figure 14.23) to instruct Xcode to build it first so it’s available when building the application target. Then, add the importer target to the app target’s Copy Bundle Resources build phase. The next time you build TestApp, the importer will be built first, then copied into the app bundle’s Resources folder when TestApp itself is built.
Figure 14.23 Establishing a target dependency
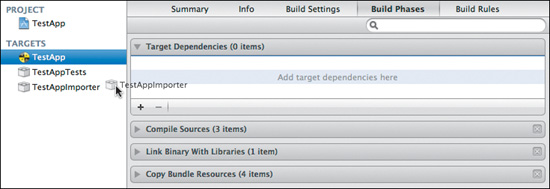
Tip
In Xcode 4.0, you cannot drag the importer target directly into the resources for some reason. You’ll need to click the Add (+) button and choose the product from the Products folder in the sheet.
The importer would not function as it currently exists. To make it work, you would need to customize the code in the MySpotlightImporter.m source file to teach it to interpret the application’s data. You would also need to teach Spotlight, by other means, how to gather interesting information from the data model you created in Chapter 10. The importer is otherwise harmless if left in the TestApp project, so you could leave it, customize it to get it working if you’re feeling adventurous, or remove the target and its source and resources from the project to keep things tidy.
Note
The code and knowledge necessary to customize the importer is beyond the scope of this book. Search the documentation for the Spotlight Importer Programming Guide for more information.
Working with Schemes
You learned that schemes tie together one or more targets with a build configuration and destinations. There is no hard set of rules that determines how many schemes a target has or how many targets a scheme has. Schemes are meant to be a simple way to switch between conceptual sets of these items—sets that make sense to your project and workflow.
There are many ways you might use the system, but the simplest example is creating separate schemes for an Apple App Store build of your application and a build that uses your own customer relations and registration management system. You might have a separate scheme to run, analyze, test, and deploy a server-side registration key generator—a command-line program that is called from your Web store’s server upon successful payment. Any way you look at it, schemes are meant to give you an extra layer of flexibility as well as a collection point for these conceptual products and code/build/run/test/distribute scenarios.
Finding Your Project’s Schemes
Unlike many of the target-related settings, schemes are right in front of you at all times. The Scheme selector control, in addition to letting you select schemes and destinations, allows you to manage, edit, and create schemes. This control, which behaves similarly to the Jump Bar, is used to select the scheme and destination but is also used to edit the currently selected scheme or manage the list of schemes. The first (leftmost) segment lets you select the scheme or lets you create, edit, and manage schemes. The second (rightmost) segment selects the destination (Mac, device, simulator, and so on) available for the selected scheme.

Managing Schemes
Figure 14.24 shows the TestApp project’s schemes, which Xcode automatically created for each target (except unit test targets—see Chapter 18). Recall the Spotlight importer example from earlier in this chapter and note its presence in the schemes list. Because the app and plug-in targets are for Mac OS X only and support both 32- and 64-bit architectures, each scheme has a 32- and 64-bit Mac destination.
Figure 14.24 The Scheme pop-up’s menu
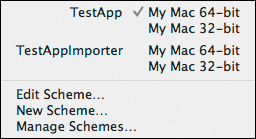
Choose Manage Schemes from the Scheme control to display the sheet shown in Figure 14.25. The sheet lets you create, duplicate, delete, reorder, rename, and generally wrangle schemes within the current workspace.
Figure 14.25 The scheme manager sheet
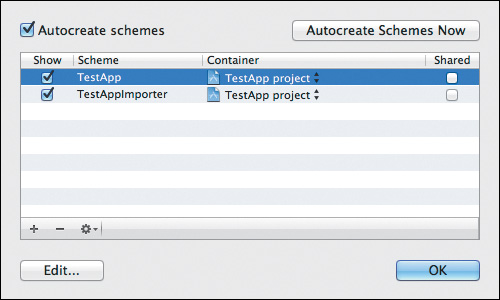
Creating Schemes
You can create a scheme by clicking the Add (+) button at the bottom of the schemes table and choosing New Scheme from the menu. A sheet (Figure 14.26) will appear asking for a target and a name. As you recall, schemes are linked to targets, so a new scheme must be given a target when created. Once you give the scheme a target and a name, click OK and you’re finished.
Figure 14.26 The New Scheme sheet
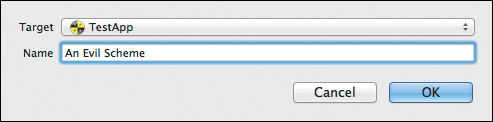
Duplicating Schemes
To duplicate a scheme, select it in the list, click the Add button, and then choose Duplicate from the menu. The duplicate scheme will be created and the editing sheet (discussed in the “Editing Schemes” section) will appear.
Reordering Schemes
You can reorder schemes by dragging them into the desired order in the list. This affects the order in which they appear in the Scheme control.
Removing Schemes
To remove a scheme, just select it and click the Remove (–) button. You’ll be prompted before the scheme is removed because this cannot be undone. If you’re certain you want to remove the scheme, click Delete to confirm and the scheme will be removed.
Importing and Exporting Schemes
You can also import and export schemes to share across unrelated projects by using the Action button to the right of the Remove button. You’ll be prompted with a standard save panel for export and a standard open panel for import.

Auto-Creating Schemes
As mentioned previously, Xcode can create schemes automatically as targets are created or duplicated within the project. This feature is active by default so that appropriate schemes will be created for targets in projects created by previous versions of Xcode and opened in Xcode 4.
To prevent Xcode from automatically creating schemes, deselect the Autocreate Schemes check box. If you want to have Xcode generate schemes automatically only when you want it to, open the Manage Schemes sheet and click the Autocreate Schemes Now button. Otherwise, you can leave this feature disabled and manage schemes manually.
Xcode version 4.0 does not remove schemes for deleted targets regardless of the auto-create setting; you must remove schemes manually.
Editing Schemes
To edit a scheme, you can double-click it in the table in the Manage Schemes sheet or select it in the Schemes control (remember to click the scheme name on the left part of the control; the right side chooses the destination) and then choose Edit Scheme from the menu. The Scheme Editor sheet (Figure 14.27) will appear. This is the same edit sheet that appears when duplicating an existing scheme. In the figure, the main TestApp target is shown.
Figure 14.27 The Scheme Editor sheet
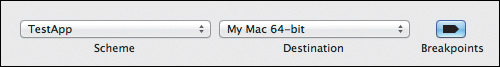
Note
At the time this book was written, Apple’s documentation of some of the settings available in the Scheme Editor was terse or nonexistent. In some cases, this book provides a best guess at an explanation and may be incomplete. Please consult Apple’s documentation if some settings don’t appear to work quite as they’ve been explained.
The Scheme Controls
The main scheme controls (Figure 14.28) are shown across the top of the editor sheet. These controls match the functionality of the Scheme pop-up as well as of the Breakpoints button next to it. The behavior of these controls can be confusing.
Figure 14.28 The main Scheme Editor controls
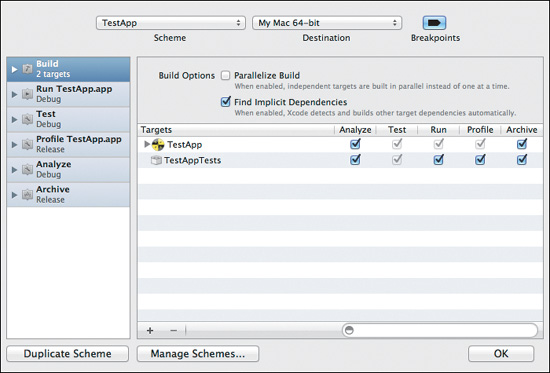
The Scheme pop-up in the editor changes the scheme currently being edited as well as the active scheme in the Scheme pop-up. Its purpose is primarily to allow you to move between schemes without closing the editor sheet. Be aware that it also affects the active scheme even after you close the editor.
The Destination pop-up is somewhat more confusing. It directly sets the active destination in the main Scheme control but does not appear to do anything more. Its presence implies you might have separate destination-dependent settings within the scheme, but this is not the case in version 4.0.
The buttons along the bottom of the editor sheet let you duplicate the current scheme, go back to the scheme manager sheet, or dismiss the editor sheet (using the OK button, which should probably be a Done button).
In the middle of the sheet are two panels, used to edit the settings of each action for the scheme. The left panel shows a list of actions corresponding to those found under the Product menu in the main menu. Selecting each action reveals that action’s scheme settings in the right panel.
The Build Action
The Build action serves as the basis for the rest of the actions. As it’s necessary to build a product before it can be run, tested, or profiled, the Build action is always performed before performing any of the other actions that need a built product. To edit this action, select it from the list on the left of the Scheme Editor sheet. Figure 14.29 shows the settings for the Build action.
Figure 14.29 The Build action’s options
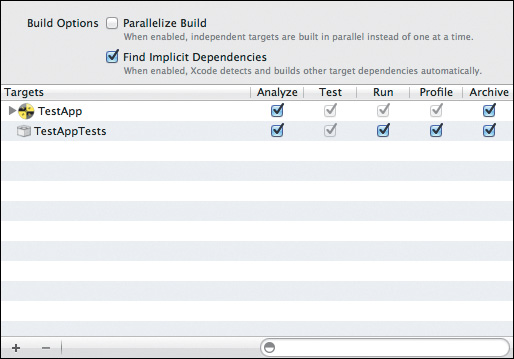
Two build options are visible at the top of the editor. The Parallelize Build option allows Xcode to build multiple independent targets—targets that do not depend on other targets—to be built in parallel, taking advantage of your modern multicore Mac. The Find Implicit Dependencies option allows Xcode to try identifying dependencies automatically. That is, if one target’s product is linked against or copied into the resources of another, Xcode can probably figure this dependency out automatically. This lets Xcode build the targets in the necessary order without your having to define the dependencies yourself. You’ll explore this in more detail in Chapters 15 and 16.
The complicated-looking table beneath the build options lists all the targets that are to be built for the current scheme. Obviously there would need to be at least one target listed here for the Build action to be helpful. Note the columns with check boxes that correspond to each of the remaining actions. These check boxes control whether the target is built automatically (if necessary) before each action is run. In the figure, two targets are listed—the TestApp application itself and the tests bundle (see Chapter 18 for more on unit tests). Notice that the check box for the Test action is selected and disabled so you cannot deselect it. Likewise, TestApp’s Test, Run, and Profile actions are selected and disabled. This indicates that a built product is required for these actions.
You can use this table to define dependencies directly (especially useful in complex situations where Xcode is unable to determine the dependencies itself). Use the Add (+) button at the bottom to choose another target within the workspace (including multi-project workspaces). You can drag the dependencies into the required order if necessary (just remember to deselect the Parallelize Build option if order truly is important).
There’s one other item of interest hiding in the Build action’s settings. Notice the disclosure triangle beside the TestApp target. If you expand it, you’ll see the TestAppImporter target you created earlier in the chapter. Because you placed the Spotlight importer product into the TestApp target’s Target Dependencies build phase, it’s been automatically included in the list (and has the same per-action settings as TestApp).
The Run Action
The Run action specifies the executable to run, the debugger to use, arguments to pass, and some environmental settings when you ask Xcode to run with the active scheme. Figure 14.30 shows the Run action’s multi-tab editor.
Figure 14.30 The Run action’s Info tab
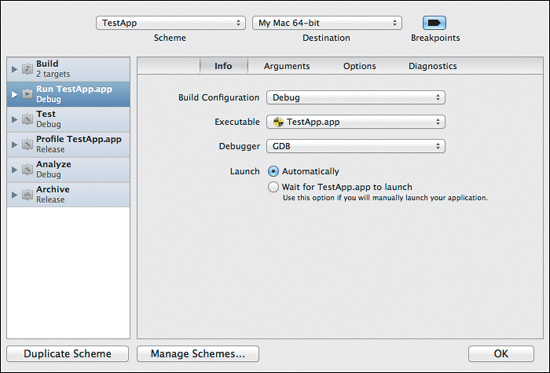
The Info tab (Figure 14.30) holds the basic settings for the Run action. The Build Configuration pop-up lets you select the configuration (such as Debug or Release) to use when running. The default is the Debug configuration so the debugger can be used. The Executable pop-up, predictably, lets you choose the executable to run. In this case, it’s the only executable available in the project: TestApp.app. Targets without executables (such as our Spotlight importer) will have their Executable set to None, since they can’t be “run” on their own. The Debugger pop-up lets you choose among installed debuggers. In Xcode 4.0, GDB is the default, while LLDB is available. The Launch options instruct Xcode either to launch the executable automatically when the Run action is evoked (the default and most common behavior) or to wait for you to launch it yourself before running, attaching the debugger, and so on.
The Arguments tab (Figure 14.31) lets you control the launch arguments, environment variables, and debug symbol loading during runtime. The Base Expansions On pop-up specifies which executable’s specific environment variables (as seen in the run logs) are to be used when expanding those Xcode supplies (such as BUILT_PRODUCTS_DIR). The Arguments Passed On Launch list lets you use the Add (+) button to add specific arguments to be passed when the application launches. This makes the most sense when running command-line programs. You use the Add button in the Environment Variables list to add or override the environment variables present (such as USER) in the application’s environment. The Module Names To Load Debug Symbols For list lets you instruct Xcode to load debugging symbols for libraries to which your application links. If you have debug symbols available for a given library, you can make their debugging information available to Xcode for use in debugging sessions by specifying the module name.
Figure 14.31 The Run action’s Arguments tab
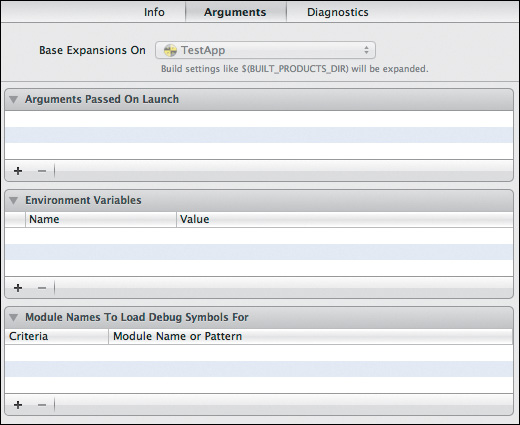
The Options tab (Figure 14.32) is for the more general runtime options. The Persistent State option disables the restoration of an application’s persistent state (API added to Mac OS X 10.7). The Document Versions option turns on additional debugging support for browsing versions in the new 10.7 document versions API. The Working Directory option lets you specify a custom working directory for the executable at runtime.
Figure 14.32 The Run action’s Options tab
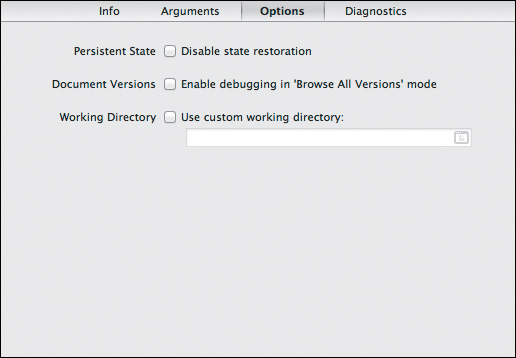
The Diagnostics tab (Figure 14.33) specifies a number of options for memory management debugging, logging details, and debugger behavior during runtime. The specifics of each of these options are beyond the scope of this book. Please see Apple’s documentation for details.
Figure 14.33 The Run action’s Diagnostics tab
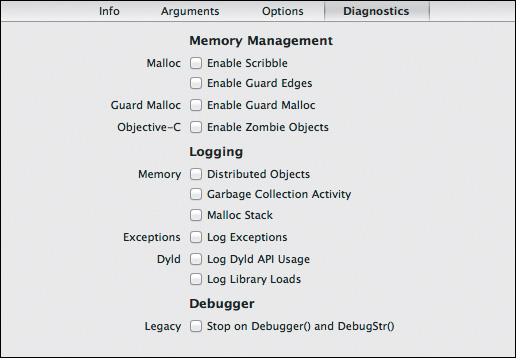
The Test Action
The Test action specifies the unit test bundle to use for the scheme. Figure 14.34 shows the Info tab of the Test action editor. When you created the TestApp project, you chose to include unit tests. This caused Xcode to create a unit test bundle for the TestApp product and add it to the tests to be run in this action. The TestAppTests bundle appears in the Tests list as a result (and it will not be skipped in this scheme because the Test check box is selected). The Build Configuration pop-up menu defaults to the Debug configuration (since Release would make it difficult to debug if the test fails). The Debugger pop-up works the same way as in the Run action—it specifies the debugger to use when running unit tests.
Figure 14.34 The Test action’s Info tab
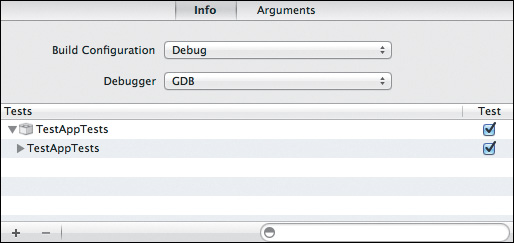
The Arguments tab (Figure 14.35) allows you to specify options similar to those of the Run action (without the ability to load extra debug symbols). The only difference is the check box at the top (“Use the Run action’s options”). This check box is selected by default and, when active, disables the Test action’s own arguments controls, using those defined in the Run action instead. Deselect this to specify a separate set of arguments and environment variables for testing. For more information on unit testing, see Chapter 18.
Figure 14.35 The Test action’s Arguments tab
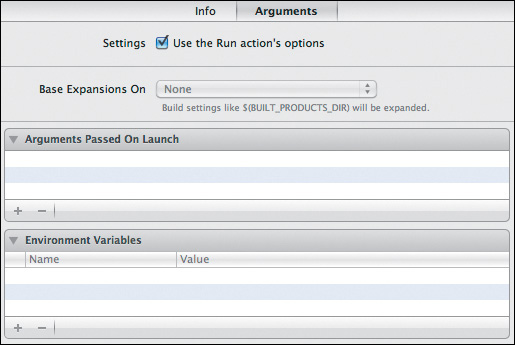
The Profile Action
The Profile action is Xcode’s gateway to launching Instruments, Apple’s code-profiling tool (covered in Chapter 20). Figure 14.36 shows the Info tab of the Profile action editor. The Build Configuration, Executable, Working Directory, and UI Resolution settings all work the same as in previously discussed actions. The key setting here is the Instrument pop-up. The Ask on Launch setting will open Instruments’ Trace Template sheet (Figure 14.37), prompting you to choose a trace instrument to use when profiling your executable. All other settings in the pop-up launch the executable within Instruments with the chosen trace instrument selected.
Figure 14.36 The Profile action’s Info tab
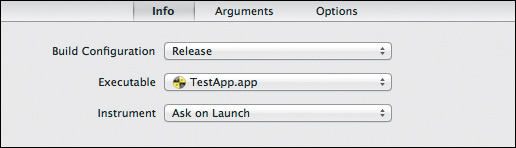
Figure 14.37 Instruments templates
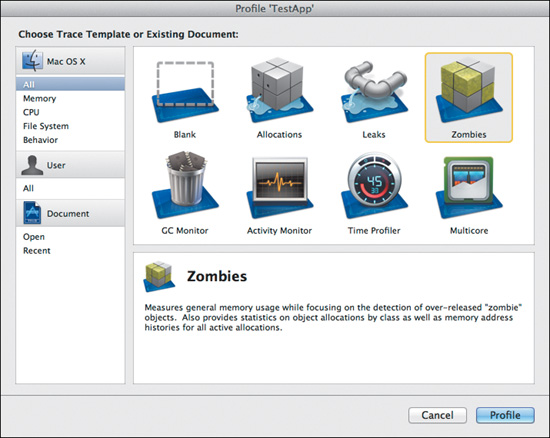
The Arguments and Options tabs work in the same way as those of the Test action. That is, you can specify arguments and environment variables or use the Run action’s settings.
Note
If you’ve selected Ask on Launch and Instruments is already running (that is, you’ve already selected a trace instrument the first time), subsequent calls to the Profile action will immediately run your executable using the previously chosen instrument without asking again. Close the Instruments window to be prompted again next time.
The Analyze Action
The Analyze action runs the static analyzer (introduced in Chapter 9 and covered in more depth in Chapter 17) against the targets specified in the Build action.
The editor has only one option: the Build Configuration pop-up. As with other actions, use this to specify the configuration (usually the default Debug or a debugger-friendly configuration) to use when analyzing the built target(s).
The Archive Action
The Archive action, covered in Chapter 12, is responsible for creating an archive of all built targets and their dSYM debugging information. The archives are suitable for submission to Apple’s (Mac and iOS) App Stores.
The editor (Figure 14.38) has only three options. The first, Build Configuration, works as expected. A Release build makes the most sense and is the default, but you’re free to create your own release-friendly configurations for use here. The Archive Name field lets you specify a name to use for the created archives. The Options section (with only one option) lets you specify via the check box that you’d like Xcode to reveal the archive in the Archives tab of the Organizer (also mentioned in Chapter 12) when the action is complete.
Figure 14.38 Archive action options
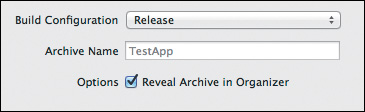
Pre-Actions and Post-Actions Scripts
You may have noticed the disclosure triangle next to each action in the Scheme Editor’s actions list. When expanded, you’ll see three entries (Figure 14.39). When you select the action, you’re viewing the options for the action itself (the middle item in the expanded action’s children), but what about the Pre- and Post-actions items? Pre-actions are things that can be done prior to the start of an action. Post-actions are done after. If you select one of them, you’ll see an empty editor.
Figure 14.39 Extra action options
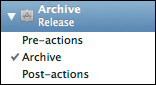
In Xcode 4.0, there are two different pre/post action types you can perform: execute script or send e-mail. Using the Add (+) button, you can add one or more of either type of action. Figure 14.40 shows a simple set of actions that notifies the pathetic humans (and their pointy-haired masters) of the completion of an Archive action.
Figure 14.40 Some example post-actions
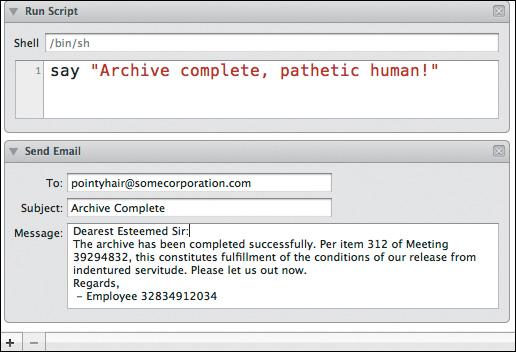
These extra hooks into Xcode’s main actions open up the possibilities for process customization considerably. See Chapter 19 for more ideas regarding interesting ways of taking advantage of Xcode’s various scripting hooks.
Entitlements (Sandboxing)
Application sandboxing is a security concept introduced in Mac OS X 10.7. Opting into this system makes your application more secure by limiting its access to various system resources unless specifically requested in the application’s entitlements.
Because of the flexibility and openness of an Objective-C application, foreign code can be “injected” into the application or the application’s binary can be modified. This code would run with the same privileges your application enjoys. By voluntarily limiting your application’s system access to only those resources it actually needs, you are reducing the chances for malicious code to achieve whatever goal it has in its evil little bytes. Much could be said on the topic, and likely will be by plenty of other books, but as always, this book’s focus is on the IDE, not the technologies it helps you control.
Xcode makes managing your application’s entitlements easy. To find their settings, navigate to the desired build target and click the Summary tab. The Entitlements section (Figure 14.41 contains a list of toggles and choices.
Figure 14.41 The Entitlements controls
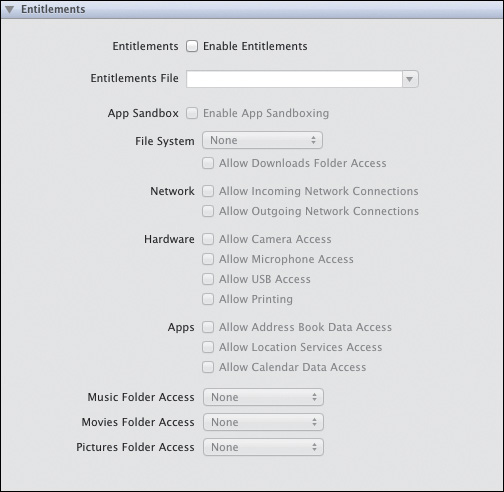
Note
Application sandboxing relies on code signing. For more information, see the Code Signing and Application Sandboxing Guide at http://xcodebook.com/codesigning.
Activating Entitlements and Sandboxing
You can turn on entitlements for your app by selecting the Enable Entitlements check box at the top of the list. You then choose an entitlements file from the Entitlements File pop-up. Xcode helpfully creates one matching the name of your target and adds it to your project (Figure 14.42. The file is a simple preference list. You can edit it by selecting it using the same preference list editor you’ve used elsewhere, but it is easier to use the Entitlements section you’re exploring now.
Figure 14.42 The Entitlements file
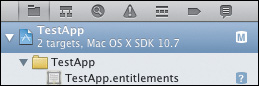
To sandbox your application, select the App Sandbox check box. Now you must grant your application access to the functionality it needs.
Setting Specific Entitlements
The remaining settings in the Entitlements section grant specific entitlements to your application.
File System
Use the File System pop-up to allow your application to read and write, to read-only, or to have no access to the file system. Select the Allow Downloads Folder Access check box to grant access to the Downloads folder regardless of the general file system access setting. File system access is disallowed by default.
Network
Use the Network check boxes to allow incoming or outgoing connections. Network communication is disallowed by default.
Hardware
Use the Hardware controls to allow access to cameras, microphones, USB devices, and printers attached to or accessible by the system. None of these are allowed by default.
Apps
Use the Apps controls to allow access to the user’s address book and calendar data as well as to location services. None of these are allowed by default.
Media Folders
Use the Music, Movies, and Pictures folders to access pop-ups that grant read-only or read and write access to each of these folders. Access is disallowed for each by default.
Wrapping Up
This chapter covers a lot of material, but Xcode’s new build system is easily the most important and arguably the most difficult concept to understand. An IDE is an environment that helps the developer manage the most basic actions performed during the course of development: building, running, debugging, testing, and deploying a product. The Xcode 4.0 approach differs significantly from that of previous versions and, as Xcode veterans will attest, has quite a learning (or un-learning) curve.
In the next chapter, you’ll expand on this knowledge by exploring the concept of plug-ins and frameworks a bit further. Then, in Chapter 16, you’ll learn to work with Xcode’s workspaces concept and the true power of automatic dependency detection by combining a framework project with the TestApp project.
15. Libraries, Frameworks, and Loadable Bundles
In previous chapters, you saw the templates Xcode provides for a variety of projects. You also learned that the project templates dictate the types of targets that will be set up for you. There’s a rich world full of products beyond applications. Not only can you write them yourself, but you can also use the work of others in the form of third-party plug-ins, libraries, and frameworks. In this chapter, you’ll explore the distinctions between these things as well as how to use them or build your own.
What are Libraries, Frameworks, and Bundles?
Libraries, frameworks, and bundles are similar in that you can think of them as prepackaged code meant to be used from within another library or application. They’re all meant to improve or expand the functionality of an executable (including those that are part of the operating system) by making their code available to it. Plug-ins, which we’ve discussed in previous chapters, are in fact a specific type of bundle.
Purists may take exception to the oversimplified descriptions that follow, but because this is a book about Xcode, we’ll keep things simple and leave the details (or extreme accuracy) for programming books.
Libraries
The term library has the same meaning on every platform. A library is the most basic form of prepackaged, shared code meant to be reused in multiple applications. Mac OS and iOS come with a number of standard C libraries and libraries specific to the operating system. In the Mac and iOS world, static libraries have the .a extension (a static object code library archive), while dynamically loaded libraries have a .dylib extension.
Static Libraries
Static libraries are linked into the executable by the linker at build time. That is, the code in the library is un-archived and copied into the executable along with your program’s compiled object (.o) files. Static libraries result in a larger executable because the library’s code isn’t shared but merely “available to copy.” An example of a common static library is libc.a, the standard C library.
Dynamic Libraries
Dynamic libraries can be loaded at launch time or when needed at runtime. The code from the library is shared and is not part of the executable. This gives the potential for faster launch times, smaller executables, and less wasted space (as a result of many executables carrying the same code linked from a static library). An example of a popular dynamic library Cocoa developers use every day (perhaps without realizing it) is libobjc.a.dylib, which contains the Objective-C runtime library.
Frameworks
A framework is a bundle of files and folders that can contain dynamic shared libraries, Interface Builder files, localized (translated) strings, headers, and media resources. It could contain nothing but a dynamic library or nothing but resources. If you’ve used Cocoa, you’ve used a collection of frameworks already.
You’ve likely heard Cocoa being called “the Cocoa frameworks.” That’s because Cocoa.framework actually is an “umbrella framework” that encompasses a number of sub-frameworks. One such sub-framework is Foundation.framework, which gives you basic strings, container classes, and so on. On a Mac, things like windows, buttons, and drawing routines come from AppKit.framework, a Cocoa sub-framework. The same goes for AppKit’s iOS cousin, UIKit.framework.
Unless your Cocoa application is fairly simple, it’s likely you’ll be using other frameworks, provided by the system or by third parties, that can be linked against to provide functionality not found in the core Cocoa frameworks themselves. At the very least, you may end up using a Cocoa framework that’s not normally automatically linked. In fact, when you created the TestApp project and specified it should use Core Data, Xcode automatically included CoreData.framework and added it to the Link Binary With Libraries build phase of the TestApp target.
Loadable Bundles
A bundle is a directory structure that appears to the end user as a single file. Applications, frameworks, plug-ins, and kernel extensions are all specific kinds of bundles.
A loadable bundle contains code and resources that can be loaded and unloaded at runtime. This enables developers to divide up their applications into modules and even provide extensibility in the form of plug-ins. For example, the Spotlight search system comes with a core set of plug-ins that teach it how to index various types of files. Third-party developers can create Spotlight importer plug-ins to allow Spotlight to index even more file types (usually files created by their own applications). Screen savers are another example. Each screen saver is a plug-in (a bundle) that teaches the screen saver application how to display yet another form of eye candy, while the screen saver application itself only takes care of loading the effects or stopping when the user moves the mouse (and possibly provides a password to unlock the screen).
Xcode comes with a dazzling array of bundle types. As you saw in the previous chapter, there are templates to create plug-ins for Spotlight, Address Book, QuickLook, System Preferences, Automator, Dashboard, and even the kernel. Alternatively, you can just choose the generic Bundle template (found under the Framework & Library template group) and optionally tack on your own extension (such as .testappplugin) to stand out from the crowd.
Loadable bundles are like libraries or frameworks that your users can install and remove by drag and drop. Although things like Spotlight plug-ins often come embedded within an application bundle (which Spotlight automatically finds), their power as standalone plug-ins that a user can add or remove themselves is often overlooked. It’s important to be aware that loadable bundles can just as often be a product in themselves as a component embedded in another product.
Using Existing Libraries and Frameworks
Using an existing library or framework is simple in Xcode, especially if it’s included as part of the operating system. At a minimum, you need to link your target against the library or framework. You learned how to do this in Chapter 14. To use a framework in code, you may need to include one or more of its shared headers.
If you’re using a framework that isn’t part of the operating system, you’ll have to distribute it with your product. This means you would have to add a Copy Files build phase to the product, specifying the framework to copy into the bundle’s Frameworks folder.
System Framework Example
Let’s use WebKit.framework as a simple example of how to use a system framework to add Web browsing capabilities to a product. You’ll add a simple window containing a Web view that automatically loads Google’s home page.
Linking Against the Framework
To link against WebKit, select the project in the Project navigator. Select the TestApp target, then click the Build Phases tab. Expand the Link Binary With Libraries phase and click the Add (+) button. A sheet (Figure 15.1) will appear, prompting you to choose from the list of available system or workspace libraries and frameworks or to add another from an alternative location. Type web to filter the list, select WebKit.framework, and click Add. In addition to Cocoa.framework, TestApp will now be linked against WebKit to gain all its super Web powers (Figure 15.2).
Figure 15.1 The Framework and Library sheet
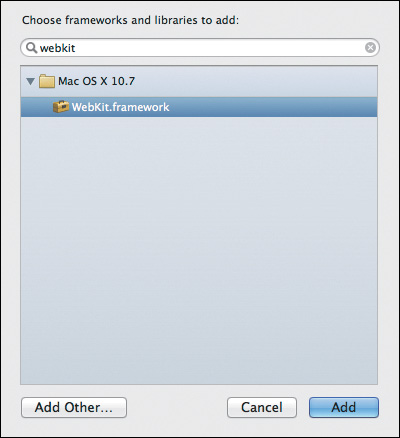
Figure 15.2 The WebKit framework in the linking build phase
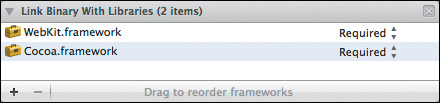
Wiring Up the UI
To display this great power (and with it, its great responsibility), you need to add some UI. Navigate to MainMenu.xib, which holds TestApp’s user interface. Add another window to the interface by dragging it from the Object library, as you learned to do in Chapter 5. I suggest a textured window for Safari-like fun. Filter the Object library for the word “web,” drag a Web view to your new window, and position it to taste. You should have something similar to Figure 15.3.
Figure 15.3 A simple Web view
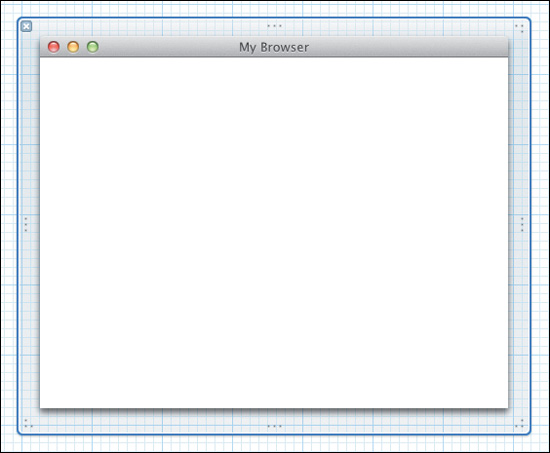
A Web view isn’t very useful without a Web site to visit. To save time, assume your only user is your grandmother, who of course ignores the address bar completely and Googles every Web address. You need an IBOutlet that you can use to communicate with the Web view, so that you can tell it to load Google.com. Use the Assistant to drag a connection from the Web view to the TestAppAppDelegate.h file, as you learned in Chapter 5. Name it webView. When you’re finished, you should have things configured as you see in Figure 15.4.
Figure 15.4 The finished workspace changes
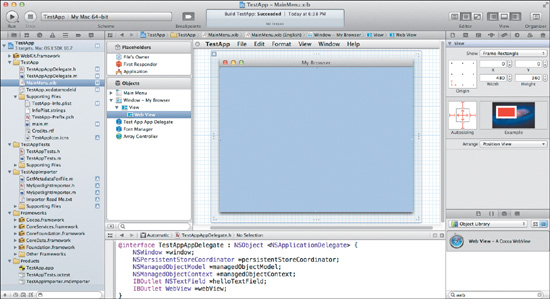
Using the Framework In Code
Now you just need to add some code to load Google.com into the Web view when the application launches. Before you can use symbols from WebKit, you have to include its main header. Since you reference a WebView as an outlet in the app delegate’s header, it’s easiest to import the WebKit header there. Since the Assistant window is already open to it, find the #import statement near the top of the source file and add the following code on a new line after it:
#import <WebKit/WebKit.h>
Navigate to the implementation file (TestAppAppController.m) and find the -applicationDidFinishLaunching: method. Add the following code into the body of the method:
NSURL * googleURL = [NSURL URLWithString:@"http://google.com"];
NSURLRequest * request = [NSURLRequest requestWithURL:googleURL];
[[webView mainFrame] loadRequest:request];
Tip
The WebKit.h header is an “umbrella” header that includes any other headers in the WebKit framework. Referencing this header includes all headers from WebKit.
That’s it. Run the application. You might have to fish around for the second window (look behind the one you’re familiar with), but it should be waiting there with Google loaded and ready for a search (Figure 15.5). Go ahead and try it out.
Figure 15.5 A working WebView showing Google.com
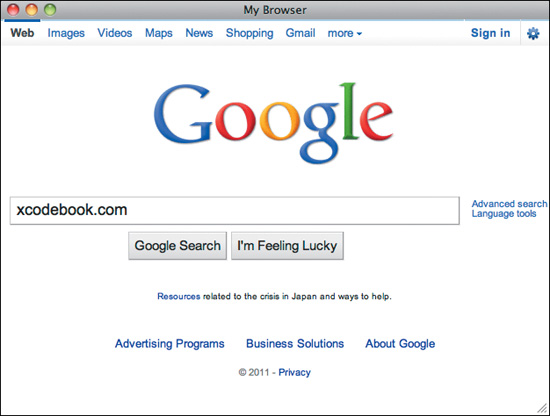
Negative Reinforcement
Now break it. To prove that the power to use a Web view comes from linking against WebKit.framework, unlink it. Navigate back to the TestApp target in the project, and then remove WebKit.framework from the Link build phase. Try running the app. I dare you. The app should terminate on launch on signal SIGABRT and spew a bunch of messages and a stack trace into the debugger console. The most interesting console message is the second one, that mentions “cannot decode object of class (WebView),” which is a good indicator you’re referencing symbols from a library that hasn’t been loaded (usually because you haven’t linked against it). To fix it again, just add WebKit.framework back into your Link build phase.
Third-Party Framework Example
Third-party frameworks require a little more work to use. Since they aren’t a part of the operating system, they must be distributed with the application. The most common way to do this is to embed the framework inside the application bundle so that it goes along for the ride when the user installs your application.
Adding a Framework to the Project
Most third-party frameworks are open source and many must be built before they can be used in your project. For this example, you can download a simple (and almost entirely useless) framework called Foo.framework from this book’s Web site. The direct download URL is http://files.xcodebook.com/fooframework/FooFramework.zip. Download the file and unzip its contents. You should see a folder titled Foo.framework.
Note
You can skip copying the framework into the project folder, but you’ll have to keep track of where all the pieces necessary to build your project are located. One way to do so is to create a conveniently located folder called Third-Party Frameworks or something similar so you always know where it is, no matter the project.
To add the framework to the project, drag Foo.framework into the Project navigator and drop it inside the Frameworks group (Figure 15.6) for neatness (although it doesn’t actually matter where you drag it—you can organize your project however it best suits you). The Add Files sheet you encountered in Chapter 6 will appear (Figure 15.7). Make sure to select the “Copy items into destination group’s folder (if needed)” check box and click Finish. The framework will be copied into the project folder and appear in the Project navigator.
Figure 15.6 Adding the framework to the project by dragging and dropping
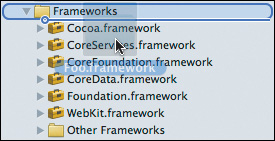
Figure 15.7 Copying items into the project folder via the Add Files sheet
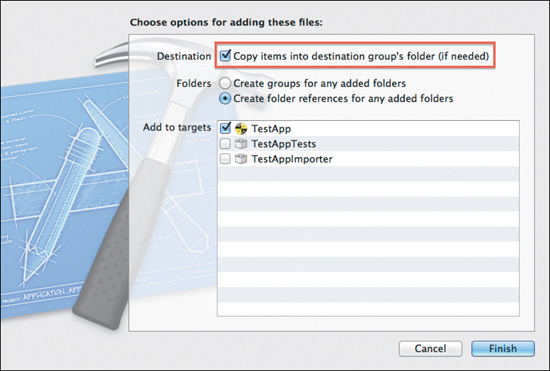
Linking Against the Framework
Unlike in the last example, Xcode has automatically added the framework to the Link build phase of the TestApp target. This was done for you because, as you saw in Figure 15.7, you accepted the default settings for the Add to Targets table (that is, you asked Xcode to add the framework to the TestApp target only). Xcode is smart enough to know that a library should be added to the Link build phase of the selected targets. You can verify this for yourself by examining the target’s Link phase (Figure 15.8).
Figure 15.8 The Foo framework in the target’s Link build phase
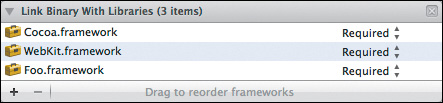
Embedding the Framework
To embed the framework within the application, navigate to the Build Phases tab of the TestApp target. Add a Copy Files build phase by clicking the Add Build Phase button at the bottom of the window and selecting Add Copy Files. Double-click the title of the new build phase and change it to Copy Frameworks for clarity. Expand the build phase and set the Destination pop-up to Frameworks. Now drag Foo.framework from the Project navigator into the Copy Frameworks phase. Your new build phase should look like Figure 15.9.
Figure 15.9 Adding the Foo framework to a Copy Files build phase with Frameworks as its destination
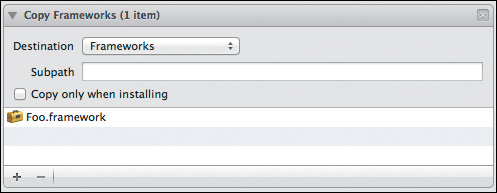
Note
You can opt to install a framework in a shared location, but the ins and outs of framework distribution are beyond the scope of this book. See the Framework Programming Guide in Apple’s documentation for more details.
Using the Framework in Code
Foo.framework doesn’t have any UI components, but it provides two classes: MyFoo and MyBar. You can verify this by creating an instance of two classes provided by the framework and logging their descriptions to the console. You’ll do this at application launch, as in the previous example, so navigate to the -applicationDidFinishLaunching: method of the TestAppAppDelegate.m source file and add the following to its body:
MyFoo * foo = [[[MyFoo alloc] init] autorelease];
MyBar * bar = [[[MyBar alloc] init] autorelease];
NSLog(@"Foo says: %@", foo);
NSLog(@"Bar says: %@", bar);
Remember to add the following to import the framework’s header so Xcode is aware of the new symbols the framework provides:
#import <Foo/Foo.h>
Tip
If you’re unsure which header to include, you can either use AutoComplete or expand the framework itself in the Project navigator list, open its Headers subfolder, and take a look around. Also, most frameworks have an umbrella header named for the framework itself, such as “Foo.h” for Foo.framework or “WebKit.h” for WebKit.framework.
Run TestApp and watch the debugger console’s output. You should see something like the following:
2011-03-05 15:50:57.623 TestApp[40877:903] Foo says: <MyFoo: 0x1006f0b10> - Foo!
2011-03-05 15:50:57.623 TestApp[40877:903] Bar says: <MyBar: 0x1006f1670> - Bar!
To summarize, the extra steps to use a third-party framework are: adding it to your project, optionally copying it into the project folder when adding it, and embedding it into your application bundle so it’s distributed with the application.
Creating a Framework
In addition to using system and third-party frameworks, it can be useful to create your own. One simple benefit is that you can place code that is shared between a Mac OS version and an iOS version of your application in a single, common location. Both can link against the same framework and benefit from improvements and bug fixes from the same source.
To familiarize you with this process, you’ll create a simple framework in a separate project and learn how to build it for release so it’s ready to use in other projects. In Chapter 16, you’ll learn how to combine projects into a single workspace, allowing Xcode to recognize it as a dependency and build and include it in TestApp automatically.
Create the Project
To create a new project, choose File > New > New Project from the main menu. Choose the Framework & Library group under the Mac OS X section. Select Cocoa Framework from the list and click Next.
The project options sheet (Figure 15.10) will appear. In the Product Name field, enter TestAppSharedFramework so you can distinguish it from the TestApp project. It’s also a good idea to make sure the Company Identifier value is the same as the one you gave for the TestApp project. You can deselect the Include Unit Tests check box for simplicity. Click Next.
Figure 15.10 Creating a new framework project
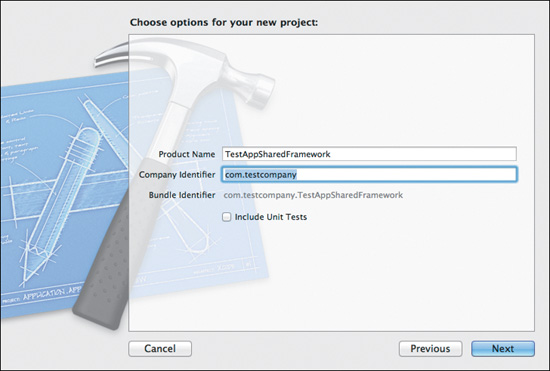
Select the “Create local git repository for this project” check box and select the same folder that contains the TestApp project folder (the TestApp folder’s parent). Make certain you don’t save it in the TestApp project folder, but one level above. Click Create to create the project. You should have a shiny new project window, as seen in Figure 15.11. Now you’re ready to add some code.
Figure 15.11 The new framework project workspace
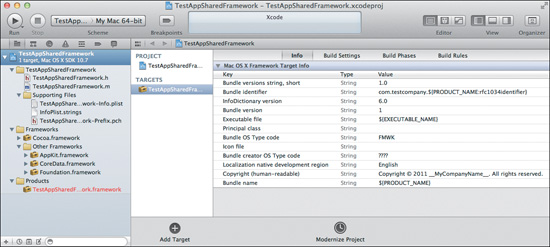
Add Some Code
As you read in earlier chapters, TestApp isn’t particularly useful for anything beyond exploring Xcode. Its shared framework won’t help it sell on the App Store either, but it will be a handy demonstration in Chapter 16.
To start with, a framework should have a simple umbrella header—that is, a header that includes all other headers needed to use the framework and that allows a one-stop import into other classes. To add this umbrella header, select the TestAppSharedFramework group in the Project navigator and then choose File > New > New File from the main menu. From the Add File sheet, choose the C & C++ category under the Mac OS X header in the list, choose the Header File template (as in Figure 15.12), and click Next. When prompted to save, leave the folder location, Group, and Add to Targets settings as they are, name the header TestAppSharedFramework (to match its parent framework’s name), and click Save. You’ll have an empty header file ready for later use.
Figure 15.12 Creating a new header file
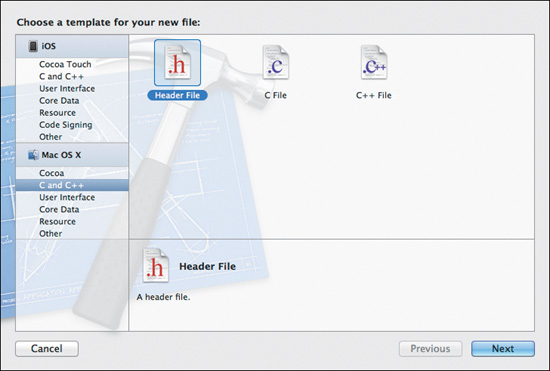
Next, you’ll add a simple class whose only mission in life is to answer its –description method with a simple “Hello World!” Repeat the New File process, selecting the Objective-C Class template from the Cocoa category. When you click Next, supply the class name NSObject for the “Subclass of” field. Click Next again to be prompted to save. Change the filename in the Save As field to TestFoo, and click Save. Make sure the TestFoo.m source file is selected in the Project navigator so that its source is visible in the editor. Just above the @end directive at the end of the file, add the following method:
- (NSString *)description
{
return @"Hello World!";
}
This gives the TestFoo class the ability to say hello when asked for its description. You’ll use that later. For now, you need to add its header file, TestFoo.h, to the framework’s umbrella header for later import. Navigate to TestAppSharedFramework.h in the Project navigator and add the following on a new line at the end of the file:
#import "TestFoo.h"
Any other classes you add to your framework can be similiarly included in this umbrella header. This way, when your framework is used, there is only one header to import, which brings the headers of any other classes along for the ride.
Try a build (Command+B) and verify there are no build issues. The framework should build cleanly.
Configure the Headers
In order to use a framework’s headers, they must be configured in the Copy Headers build phase. To do so, navigate to the project itself and then select the TestAppSharedFramework target in the list. Next, select the Build Phases tab and expand the Copy Headers phase (Figure 15.13).
Figure 15.13 The Copy Headers build phase
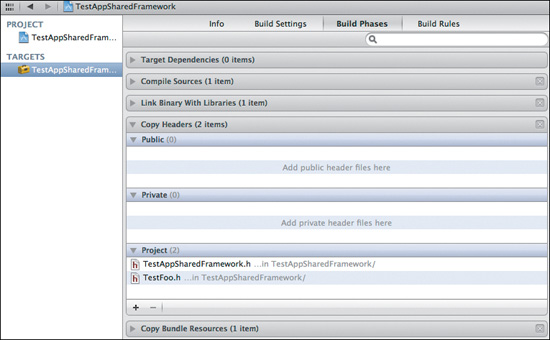
Note that the headers automatically appear in the Project group. In order to use the framework’s code, the headers must be made public. To do so, drag both the TestAppSharedFramework.h and TestFoo.h headers into the Public group, as shown in Figure 15.14.
Figure 15.14 The framework’s headers made public in the Copy Headers phase
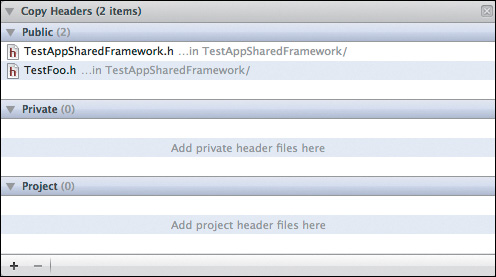
To have a look at the innards of your newly minted framework, build one more time (Command+B) and then expand the Products group in the Project navigator. Right-click (or Control-click) the TestAppSharedFramework.framework product and choose Show in Finder from the pop-up menu. Figure 15.15 shows the fully expanded folder structure with the code library and its public headers.
Figure 15.15 The built framework’s file structure
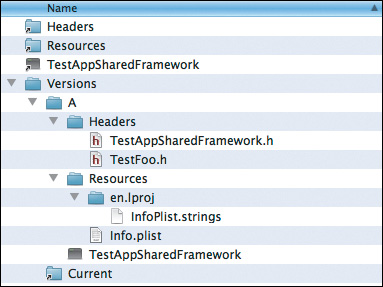
Tip
If you wanted to use this framework right now, you’d have to archive it or manually create a release build scheme and build it with that scheme. See Chapter 19 for alternative deployment build approaches.
That’s all there is to it. You have a fully functional framework with some custom code that could be shared between multiple projects. You’ll use this framework in TestApp in Chapter 16.
Tip
It’s very common (and considered good practice) for developers to create test application targets alongside the framework. This application is used to test your framework as it’s being developed.
Wrapping Up
You’ve seen how to create plug-ins and frameworks and learned how to use them in other projects. In the next chapter, you’ll see how you can combine multiple projects into a single workspace and even create dependencies between them so you can build your new TestAppSharedFramework framework and include it in TestApp on each build.
16. Workspaces
Up to this point, the TestApp project has been just that—an Xcode project. The collection of files and folders are bound by an .xcodeproj file that contains all the project-wide settings (such as a description of your schemes and targets). Throughout the book, however, the word “workspace” has been used as a more general description of the project and the window that contains it all. A true workspace encompasses multiple projects.
What Is a Workspace?
Xcode 4 introduces the idea of a workspace as a kind of project binder—a container for multiple projects. A project groups together its related files and settings; a workspace binds multiple related projects. A workspace merely contains pointers to Xcode projects. Projects remain distinct in that you can remove them from a workspace without affecting the project’s content or settings. In other words, the project can still be opened and edited outside its workspace. Workspaces give you several advantages over projects that reference files and built products from other projects.
Projects contained within the same workspace share a common build location. This makes it possible for one project to use another’s built products. This one feature makes a world of difference for managing complex applications and application suites. It makes it far easier, for example, to include the built product of a common framework project into one or more of your application projects.
The automatic dependency detection you learned about in Chapter 14 extends to the workspace level as well. This means that including a product’s framework in the target of an application project within the same workspace usually requires no additional work for Xcode to recognize the dependency. As with dependent targets within the same project, Xcode will see this dependency and build the framework before building the application. In other words, you don’t have to copy shared libraries into each project folder in which you intend to use the library.
Note
Xcode may not be able to detect complex dependencies automatically. In this case, you’ll need to disable the Find Implicit Dependencies setting of the affected scheme and add and sort the interdependent targets manually.
Another benefit of a workspace is shared indexing. A project index is used primarily for features such as code completion (Code Sense). Xcode’s automatic code completion and refactoring facilities will take the symbols of all projects included in the workspace into account. This means code completion will automatically find your framework project’s symbols and make them available to you when editing source files in the application project that uses the framework.
Still another benefit of workspaces pertains to schemes. A standalone project might contain a primary scheme for building, testing, and profiling a primary product in addition to schemes for smaller, dependent targets (such as a Spotlight plug-in). In a workspace, you may only want to see the scheme for each project’s primary product. Using the Manage Schemes panel you explored in Chapter 14, you can specify whether the schemes for those smaller “sub-targets” are visible at the workspace level or only when the project is opened individually. This can help keep the list of schemes short and manageable, hiding unnecessary detail from the various projects within the workspace.
When to Use a Workspace
It’s hopefully obvious that a workspace is useless without two or more projects. Less obvious but just as important is that a workspace doesn’t help with multiple unrelated projects. A workspace is only helpful for two or more projects that must share each other’s code and resources. Let’s look at two real-world examples.
Distinct Applications
Imagine Acme Corporation has a whole host of unrelated desktop (and even mobile) applications. Here, “unrelated” means a calculator application, a calendar application, and an address book application. Each of these applications has only one thing in common: They’re products of Acme Corporation.
Being the property of the same business entity, the applications presumably use the same software registration system, company logo, contact information, and so on. They may even be able to share user data among them. This means each application would use the same code, resources, or both.
A change to the Person and Event classes, for example, might need to be updated in both the address book and calendar applications. While these classes may or may not be wrapped in a library or framework, it makes little sense to maintain two copies of Person and Event (one in each project). Here, a separate project that at least contains the common model-layer classes (and corresponding unit tests) makes sense. A separate framework project makes even better sense.
Since the applications are otherwise unrelated, each application might have its own workspace that includes the application project and the shared framework project.
Application Suites
Imagine Acme Corporation’s desktop calendar application has gone where no calendar application has gone before. Against all odds, it has become a best seller, and users are clamoring for mobile versions for their various devices. Acme Corporation, in addition to its other products that share company-wide resources, now has a product that supports two platforms, shares company-wide resources, and has a device synchronization library to let users share calendar information between their devices and their desktop computers.
In this case it would make sense to have a workspace containing the two application projects (Mac OS and iOS), their sync library project, and the company-wide resource project.
Creating a Workspace
Creating the workspace is easy. Choose File > New > New Workspace from the main menu. A new workspace window will appear with a Save As sheet prompting you for a location in which to save it (Figure 16.1). Note in Figure 16.1 the two project folders you created in previous chapters—TestApp and the shared framework you created in Chapter 15.
Figure 16.1 Saving a workspace
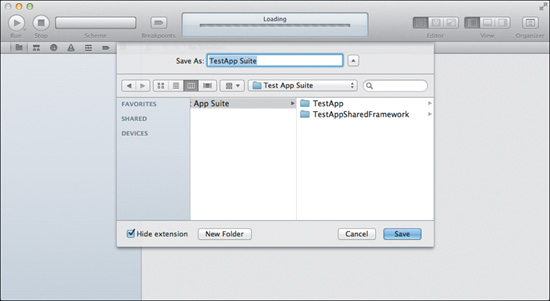
The common parent folder that contains these two project folders is a good place to keep the workspace file so that it’s easy to find. Enter TestApp Suite as the workspace name so it’s clear that this workspace contains subprojects belonging to the whole TestApp suite of applications (a Mac OS X app, an iOS app, and a shared framework between them, in the product plan of your imagination). Once you’ve chosen the name and location, click Save. The sheet will close and leave you with a disconcertingly empty workspace window.
Adding Projects to the Workspace
Now it’s time to add the projects to the workspace. Using the Finder, navigate to the folder containing the workspace and projects. For each project (the application and the framework), find its .xcodeproj file (Figure 16.2) and drag it into the Project navigator list of the TestApp Suite workspace window (Figure 16.3).
Figure 16.2 Locating individual project files with the Finder
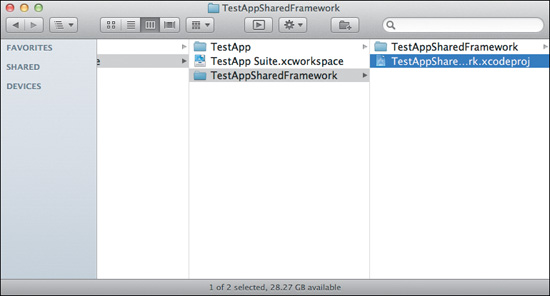
Figure 16.3 Dragging projects into a workspace
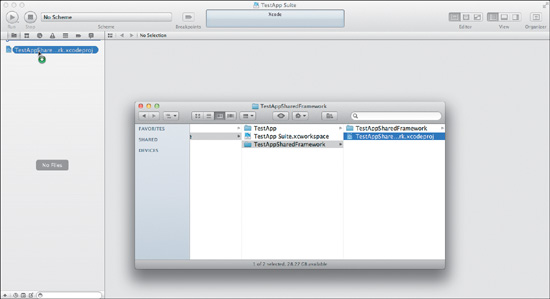
After you add the first project, take care to drop subsequent projects either above or below existing projects, keeping the blue insertion bar as far left as possible. Dropping a project into another makes it a subproject, which is not the same thing. Figure 16.4 shows the TestApp project being inserted above the framework project and not inside it.
Figure 16.4 Carefully inserting additional projects into a workspace
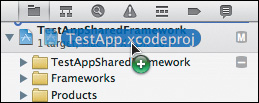
Note
A subproject is treated as an implicit dependency of the project in which it is contained and doesn’t benefit from shared build locations without careful configuration.
Managing Inter-Project Dependencies
You can allow TestApp to use the shared framework you created in Chapter 15 (building it first if necessary) by adding the framework to the TestApp target’s Link and Copy Frameworks build phases. To do so, navigate to the TestApp project, select the TestApp target, and then select the Build Phases tab. Expand the Link Binary With Libraries phase and click its Add (+) button. You’ll be prompted with the standard libraries and frameworks chooser (Figure 16.5).
Figure 16.5 Choosing the framework product from the frameworks and libraries panel
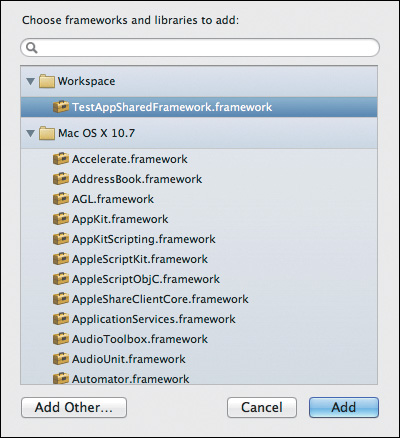
Note the new “Workspace” group at the top of the list. Xcode knows that a framework target exists within one of the projects within the TestApp Suite workspace. Select TestAppSharedFramework.framework and click Add. The framework is now part of TestApp (Figure 16.6).
Figure 16.6 Linking the TestApp product against the shared framework
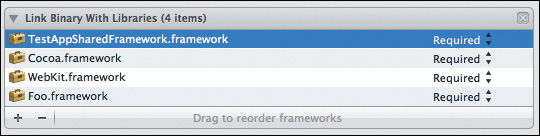
To test it, clean the workspace by selecting Product > Clean from the main menu. Then make sure the TestApp scheme is selected in the Scheme pop-up and build the application.
Of course, as you learned in Chapter 15, TestAppSharedFramework isn’t a system-provided framework, so you’ll need to distribute it within TestApp. Although TestApp would run in the development environment, it would crash due to a missing library were you to distribute it in its current state (recall this from Chapter 15 when you added a Copy Frameworks build phase for the foreign Foo.framework). You can simply drag TestAppSharedFramework.framework from the TestApp project into the TestApp target’s Copy Frameworks phase (Figure 16.7).
Figure 16.7 Adding the shared framework to the Copy Frameworks build phase
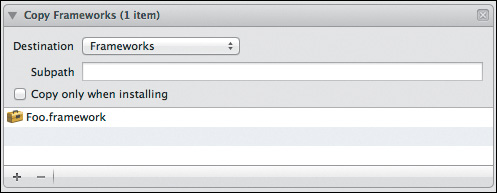
As you may also recall from Chapter 15, in order to use the framework, you’ll need to include its header. To verify that everything is working, add the following to the header include section near the top of the TestAppAppDelegate.m file:
#import <TestAppSharedFramework/TestAppSharedFramework.h>
At the end of the -applicationDidFinishLaunching: method—which should now be familiar to you—add the following:
TestFoo * testFoo = [[[TestFoo alloc] init] autorelease];
NSLog(@"TestFoo says: %@", testFoo);
Figure 16.8 shows the complete -applicationDidFinishLaunching: method. Once you’ve finished, run TestApp and check the debugger console for a successful message from the TestFoo class that comes from TestAppSharedFramework.
Figure 16.8 The complete -applicationDidFinish Launching: method
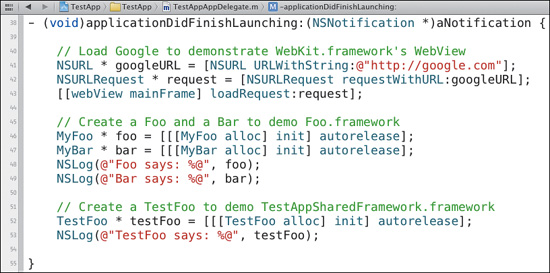
Managing Schemes in Workspaces
You learned the ins and outs of managing schemes in Chapter 14. Here you’ll manage them from another perspective—schemes as they exist within a workspace.
You’ve no doubt noticed schemes from each project show up in the Schemes pop-up in your new TestApp Suite workspace. The schemes are inherited from the workspace projects in which they exist. Figure 16.9 shows the schemes from both the TestApp and TestAppSharedFramework projects.
Figure 16.9 The Schemes pop-up menu showing workspace-wide schemes
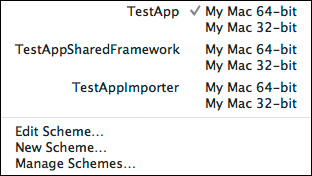
Choose Manage Schemes from the Schemes pop-up to reveal the now-familiar scheme manager (Figure 16.10). There are two major questions to consider for each scheme in a workspace: Should it be shown, and in what container should it exist?
Figure 16.10 The scheme manager
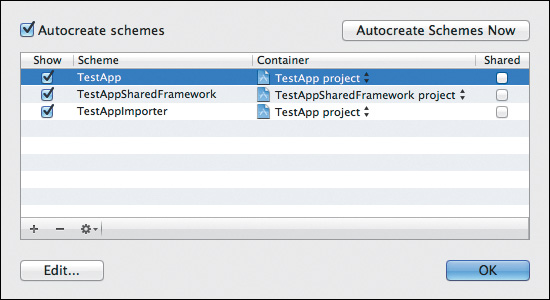
Showing and Hiding Schemes
In Figure 16.10, note the Show column in the list of schemes. Though all schemes are visible in the scheme manager, deselecting the Show check box for a scheme removes it from the Schemes pop-up control.
In the TestApp Suite, you have only an application and its shared library. When looking at it from the workspace perspective, it may be necessary to show only the application and the framework schemes. Since the TestAppImporter target that you created earlier is a dependency of the TestApp target, you may not want to bother seeing it from the workspace perspective.
It’s important to note that the Show settings for each scheme persist whether you’ve opened a workspace containing it or the project itself. In other words, if you change this setting for a project’s scheme, the change appears in the workspace (and if you change it in the workspace, it appears in the project’s settings as well).
Changing a Scheme’s Container
The Container field of the scheme manager indicates where the scheme is stored. This field lets you move schemes by changing their container to another project. When viewing the schemes at the workspace level, you can move schemes to be contained entirely in that workspace. This capability lets you create a shared scheme that builds an entire suite of products from disparate projects with a scheme that only appears when working with the entire workspace.
Note
Recall that the scheme manager’s Shared check boxes dictate whether a scheme shows for other users who open the project or workspace. In a team setting, there will likely be at least one shared scheme—the scheme to build them all.
Another Kind of Workspace
The term workspace has been overloaded in the software industry. Its meaning in Xcode is no exception. It makes sense that Xcode calls its new feature “workspaces” (a good name for a feature that binds projects together), but in the broader sense, your workspace refers more to the layout and configuration of your project.
Your Xcode workspace includes, among other things, controls for whether or not certain auxiliary views are enabled. Xcode 4 helps you maintain control of your workspace by using behaviors. Under Xcode’s Preferences (Command-Comma), the Behaviors panel reveals a number of configurable options (Figure 16.11).
Figure 16.11 The Behaviors panel
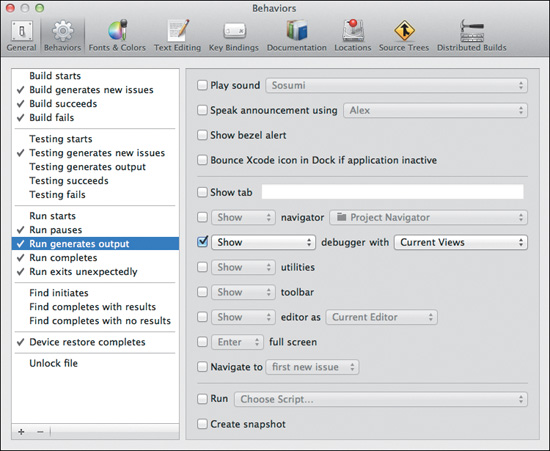
Although there are many options, the feature is simple. Each item in the list on the left can trigger any of the actions on the right. Behaviors affect all projects and workspaces (the bound-together-projects kind). With Lion’s auto-hiding scroll bars, it’s easy to miss, but both the left and right lists are scrollable. Figure 16.11 shows the window large enough to see the contents of both lists without scrolling.
Uses for Behaviors
An example of a custom behavior would be to not show the debugger when the app runs (“Run starts”) unless the application generates output (“Run generates output”). Another might be to create a new tab and navigate to the current run log in that tab if the app crashes (“Run quits unexpectedly”). The options are simple and speak for themselves. They allow navigation, activation of the various editing modes and assistant panels, running scripts, and so on.
Defining Behaviors
Xcode already has a number of common situations in the list on the left side of the Behaviors panel. To configure a behavior for a given situation, select the situation on the left and use the check boxes to enable each custom behavior. Those that are customizable have additional controls to the right of their check boxes. Situations that have defined behaviors have a check mark to the left of their names.
Creating Custom Behaviors
In Xcode 4.1, Apple has introduced custom behaviors. Although these behaviors aren’t triggered automatically like the built-in ones, you can create them and trigger them via the Xcode application menu (Figure 16.12) or with a custom keyboard shortcut.
Figure 16.12 The Behaviors menu
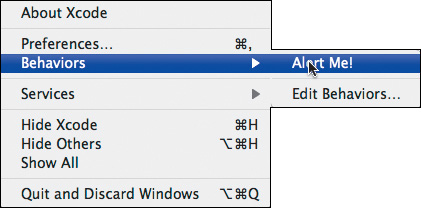
To create a new behavior, open the Behaviors panel and click the Add (+) button in the lower-left corner. You can name the new behavior whatever you wish. Figure 16.13 shows a custom behavior named “Alert Me!” whose only action is “Show bezel alert.”
Figure 16.13 A custom behavior
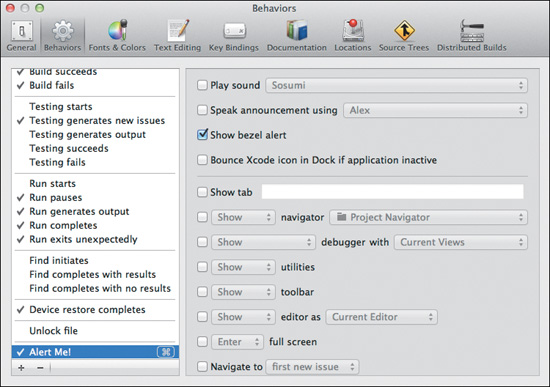
Double-click the Command symbol (the same symbol you see on your Command key) to the right of the custom action name to assign a custom keyboard shortcut to it. Press the combination of keys, then use your mouse to select another entry and end editing the shortcut. Figure 6.14 shows the custom action with a new (and hard to press) shortcut.
Figure 16.14 Defining a behavior’s keyboard shortcut

When you press the keyboard shortcut (while Xcode is active), the bezel alert will appear for a moment (Figure 16.15). While unexciting (the bezel alert function only shows the name of custom alerts), it’s easy to see how a simple set of keyboard shortcuts could easily switch your Xcode workspace among a number of different configurations tailored to the task at hand.
Figure 16.15 A useless bezel alert invoked by a behavior shortcut

Wrapping Up
The idea of Xcode’s new workspaces feature can seem intimidating at first. You’ve seen that it’s really quite straightforward. A workspace provides a way of tying related projects together to take advantage of Xcode’s (usually) intelligent dependency discovery. In the next chapter, you’ll explore some of Xcode’s more advanced debugging and analysis capabilities.
17. Debugging and Analysis in Depth
You scratched the surface of Xcode’s debugging and analysis capabilities in Chapter 9 by looking at the most common features developers are likely to use. In this chapter, you’ll explore another powerful feature—the static analyzer—and then delve deeper into the Debug navigator. After that, you’ll take a close look at the debugger console and some of its useful command-line interface tricks. You’ll round out the tour by learning how to debug iOS applications on the device or by using the iOS Simulator.
Using the Clang Static Analyzer
LLVM (the modular compiler) provides static analysis functionality via Clang, its C language family front end. The Clang Static Analyzer performs semantic analysis and can find logic problems, memory management errors, dead stores (unused variables), and API usage problems. This functionality is built right into Xcode.
When you invoke Xcode’s Analyze action, the analyzer works to identify problems with your code. If an issue is found, it is flagged in the Source Editor and in the Issue navigator alongside errors and warnings (Figure 17.1). Clicking the issue in the editor or the Issue navigator reveals details about the issue in the editor, including helpful blue lines indicating the problematic code path with descriptions of your errant actions along the way (Figure 17.2).
Figure 17.1 An issue highlighted by the static analyzer
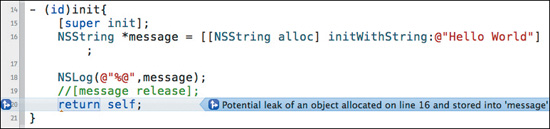
Figure 17.2 A static analyzer issue expanded into steps
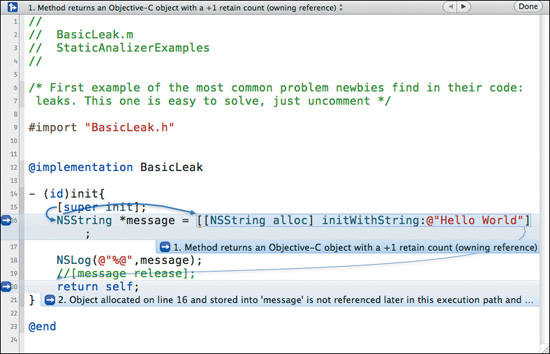
Tip
The Clang Static Analyzer can be run as a standalone tool, providing textual output of its analysis results. Its integration with Xcode is what provides the much nicer graphical interface.
For issues that are spread over longer bodies of code, following all the curved blue lines can be confusing. Xcode helps you with this in two ways. First, expanding an analyzer issue in the Issue navigator reveals the individual points in the problematic code path. Second, and by far more helpful, an analyzer results bar (similar to a search bar) appears at the top of the editor (Figure 17.3). This bar lets you navigate the analyzer issue step by step so it’s easier to follow along with the analyzer’s complaints.
Figure 17.3 The analyzer results bar atop the Source Editor

You can find some of the following issues with Instruments (see Chapter 20) and by using draconian warning levels, but the analyzer can find them while you’re coding and show you exactly where and how you went wrong. Apple’s own documentation suggests you get into the habit of analyzing early and often.
Note
Recall that errors, warnings, and analyzer results are called “issues.”
Exploring Analyzer Results
Following are a few examples of the types of issues the static analyzer can identify for you, with a walk-through of each result.
Memory Leaks
A simple description of a memory leak in a Cocoa application is an object to which you’ve lost any references and which thus can no longer be told to release its memory and go away. In this sense, the object’s memory is “leaked” as it cannot be reclaimed for the remainder of the application’s lifetime. Further, the object keeps living, which, depending on what the object does, can cause unexpected and sometimes very bad behavior.
Figure 17.2 showed an analyzer result for a memory leak. In this case, an NSString is leaked. From the top of the -init method, execution path is followed through the method. The issue is broken down into the two “steps” in the code that caused it.
In the first step, the instruction on line 16 returns an object with a +1 retain count (which, in a memory-managed environment, makes you responsible for properly releasing the object when necessary). In the second step, the method returns without releasing (or autoreleasing) the NSString instance beforehand. This means the NSString instance has been leaked at this point.
In the example, the fix is simple: Just uncomment line 19, where the string instance (assigned to message) is sent a -release (or you could send it an -autorelease).
Notes
The code examples used are “quick and dirty” demonstrations and should not be used as examples of good coding practices for a number of reasons.
The memory management descriptions given here are oversimplified, but the particulars are beyond the scope of this book. For the purposes of this chapter, memory management issues refer to Objective-C objects in a manually memory-managed (versus garbage-collected) environment.
Memory Over-Releases
Again in simple terms, an over-release in a Cocoa application is when an object is sent a -release too many times, causing its memory to be deallocated too soon. Any subsequent attempt to communicate with it will cause your application to crash. In Figure 17.4, the analyzer finds a potential over-release scenario on line 27.
Figure 17.4 A memory issue flagged by the static analyzer
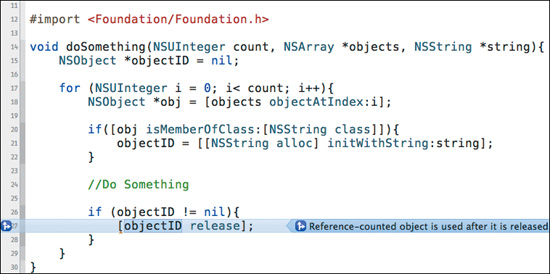
When expanded (by clicking the blue issue bar in the editor), you see the description of the problem is considerably more complex (Figure 17.5). There are four steps to follow through the problem this time. Some sets of blue arrows are bold and some are light. Two of the steps are on line 27 (both can be seen by clicking the gray disclosure triangle on the right side of the step).
Figure 17.5 The complexity of the memory issue revealed by the static analyzer
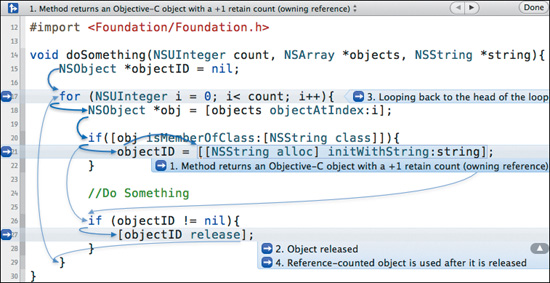
To make sense of all this, it helps to use the arrow buttons in the analyzer result bar navigator to jump between steps. As you navigate the highlighted code paths, you’ll notice different sets of arrows are bold to emphasize that particular step along the path. In Figure 17.6, the second step is selected, so Xcode highlights the flow of execution from line 22 to 26 to 27, where the analyzer tells you that the object created on line 22 is released if the if condition on line 26 is met.
Figure 17.6 The highlighted second step of the memory issue
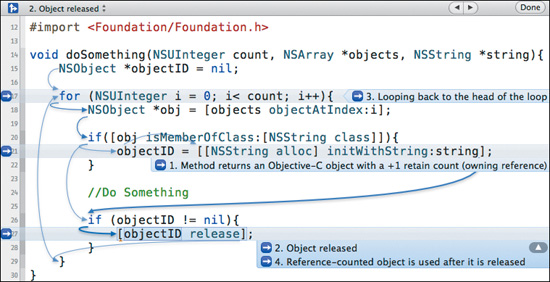
Taking the issue step by step, you see that the first step shown in Figure 17.5 tells you an object is created and assigned to objectID with a retain count of +1, meaning you’re responsible for its release.
The second step in Figure 17.6 shows that the object is released on line 27. While there’s no guarantee that its retain count is now zero (flagging it for deallocation) because other objects might have since retained it, the third step (not shown) demonstrates the code path returning to the head of the loop it was in.
The fourth and final step (Figure 17.7) reveals the end result: if ever the if condition on line 20 evaluates to false, the object in question will be accessed after having been released.
Figure 17.7 The highlighted fourth step of the memory issue
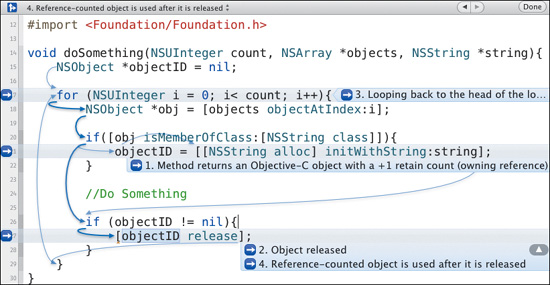
This is a good demonstration of the power the static analyzer puts in your hands. It follows all the possible paths through your code, highlighting a problem if one series of logical branches is followed.
Note
The static analyzer is smart enough to know when Objective-C garbage collection is unsupported, supported, or required in your code and adjusts accordingly for memory-management-related issues.
Logic Errors
Logic errors can cause crashes or more subtle problems. In complex code, they can be easy to miss and difficult to debug, but the static analyzer picks them up and highlights them easily.
One type of logic error is using an uninitialized variable. A variable declared without an initial value can point to any old garbage lying around in RAM. Attempting to access that variable gives you undefined or garbage values. Figure 17.8 demonstrates this problem in a basic scenario (the second step is highlighted in the figure).
Figure 17.8 A logic issue flagged by the static analyzer
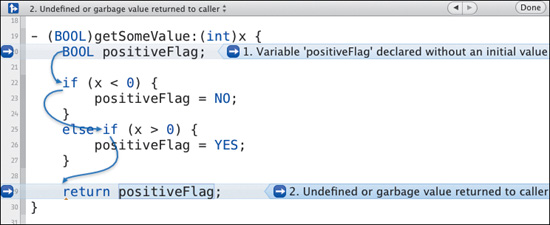
On line 20, a BOOL variable named positiveFlag is declared with no initial value. Because the code inside the if/else if blocks (lines 22-27) may not be executed, the positiveFlag may never have a defined value assigned to it before the value is returned in line 29.
Threads and Stacks
Chapter 3 introduced the Debug navigator, and Chapter 9 took you in for a closer look at features a typical developer will use most often. Here you’ll see several other features that more-experienced developers will be looking for.
Reviewing the Debug Navigator
The button bar at the bottom of the Debug navigator has two controls (Figure 17.9). When activated, the button on the left side of the bar filters out any threads that aren’t relevant to the current debugging session. That is, only crashed threads and threads with debugging symbols available (those for which you have source code or have saved debugging symbols) will be shown. When the button is inactive, all threads are shown.
Figure 17.9 The Debug navigator’s bottom control bar

The slider control affects how much of each thread’s stack you are shown. When the slider is all the way to the left (Figure 17.10), only the top frame of each thread’s stack is shown. When the slider is all the way to the right (Figure 17.11), all frames of each thread’s stack are shown. As you slide the control from right to left, Xcode begins to collapse the stack by filtering out frames that represent recursive function calls, internal Cocoa API calls, disassembled object code, and finally all code that doesn’t belong to your workspace. Figure 17.12 shows the slider three quarters of the way to the right with the collapsed portions of the stack represented by a dashed line.
Figure 17.10 A minimal stack
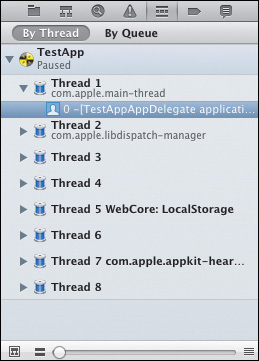
Figure 17.11 A full stack
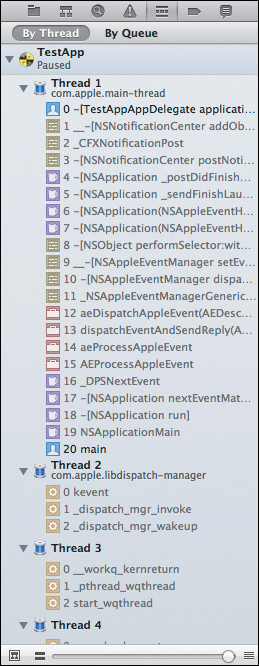
Figure 17.12 A semi-filtered stack
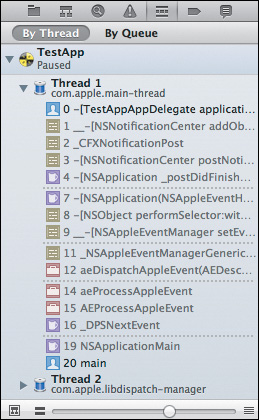
You also learned in earlier chapters that you can navigate to a method by clicking a stack frame in the Debug navigator. If source or disassembled object code is available for the frame, it will be displayed in the Editor area.
Working with Dispatch Queues
With Mac OS X 10.6, Apple introduced Grand Central Dispatch. This new facility makes it far easier for developers to take advantage of multiple cores. Rather than focusing on the deeper complexities of threads, thread pool management, and all that they entail, Grand Central Dispatch is intended to abstract these notions away into “units of work submitted to a queue.”
Queues act as a logical group of background tasks and are created at runtime. A queue can be paused and resumed, can process tasks serially or in parallel, and can even be given simple names to help the developer with debugging efforts. By default, your application’s main thread runs in a dispatch queue named com.apple.main-thread. You might create a queue to process pictures into thumbnails (one task per picture) in parallel and name it com.acme.testapp.thumbnailer.
In Xcode’s Debug navigator, you can choose to view the list of threads grouped by the Grand Central Dispatch queues to which each belongs. Figure 17.13 shows the Debug navigator as it appears with By Queue selected in the filter bar at the top of the view. Here, TestApp is paused in its -applicationDidFinishLaunching: method, which is being run in the main thread, which in turn belongs to the com.apple.main-thread queue. Other queues may be visible, depending on your code and that of the various frameworks and libraries you use.
Figure 17.13 The Debug navigator grouped by queue
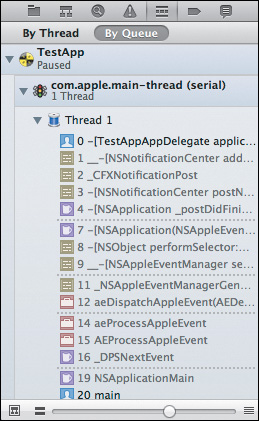
Tip
Learn more about Grand Central Dispatch at http://developer.apple.com.
The most important reason for remembering this is that when you create your own queues with Grand Central Dispatch, you can give them a meaningful name so you can identify them clearly in the Debug navigator and (as you’ll discover in Chapter 20) when using Instruments to profile your code.
Suspending Threads
Grand Central Dispatch notwithstanding, threads are still threads, and the typical Cocoa application has several of them hanging around whether you created them or not. If you have created some threads of your own directly, chances are you did it wrong the first (several) times. You realize this because things are freezing, crashing, or just not acting right. It can be helpful in these cases to suspend a thread at runtime to keep it from interfering with other parts of your application or simply to examine it.
Why not just use breakpoints? Suspending a thread is different from using a breakpoint in two important ways. First, a breakpoint will pause execution regardless of the thread calling the instruction. That is, each time a breakpoint is encountered and execution is paused, the thread that hit the breakpoint could be any thread. Second, your goal may be to suspend only some background process your application is performing, not the entire application itself.
To suspend a thread is simple. Make sure you’ve paused the application in the debugger (either at a breakpoint or by using the Pause button in the Debugger Bar), then right-click (or Control-click) the thread in the Debug navigator and choose Suspend Thread from the menu. A red indicator will appear to the right of the suspended thread, showing that it is suspended. You could at this point resume the application (by hitting the Continue button in the Debugger bar) and the thread will remain paused—for good or ill—while your application goes about its business. To resume the thread, you’ll need to be paused again, right-click (or Control-click) the paused thread, and choose Resume Thread from the menu.
Note
Suspending a thread can cause unintended consequences that make your application act strangely at best or corrupt its data, freeze, or crash at worst. Pausing a thread that holds a lock, for example, could deadlock other threads. Use with caution.
Inspecting Memory
In addition to allowing you to set watches (instructing Xcode to notify you if a memory address has changed), Xcode 4 allows you to view the contents of locations in memory. Given a memory address (usually found by a specific variable that uses it), Xcode can let you examine the memory contents directly. These tools are useful when you want to know when a variable’s value changes and the precise nature of the changes to a location or region in memory.
Watching Addresses
The ability to set a watch on a variable’s memory address and be notified when its content changes is a common feature in most any IDE. In Xcode 4, this is done by pausing the debugger and showing the Debug area’s Variables view (Figure 17.14), then right-clicking the variable and choosing Watch Address of “variableName” from the menu.
Figure 17.14 The Variables view in the Debug area
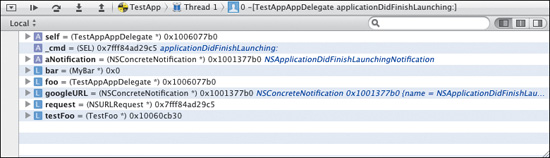
Figure 17.15 shows how to set a watch for the bar variable you created in TestApp in earlier chapters. Nothing special happens immediately after you set the watch. It’s only when the contents of the watched variable’s address changes that you are notified in the debugger console.
Figure 17.15 Setting a watch
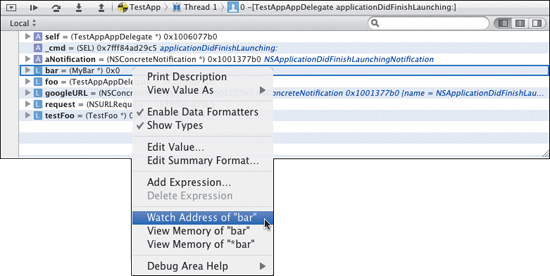
In Figure 17.16, you see that the instruction on line 47 was executed, assigning a newly created object to the bar pointer. The memory for that address was updated to point to the address of the new object, so the contents of the memory address for the bar pointer is now the memory address of the newly created object assigned to it. This information is shown in the console.
Figure 17.16 The bar pointer, updated
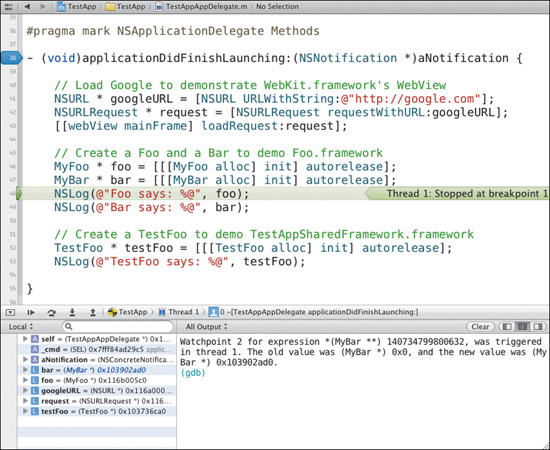
Watching addresses is a quick and dirty way to see what’s going on with a particular variable in memory, but it’s like looking at memory through a keyhole. Xcode provides a much better way of viewing the contents of your application’s memory.
Viewing Memory
The easier way to inspect the contents of your application’s memory requires pausing the application at least momentarily and locating the memory address you want to view by the variable that represents it. This works the same way as setting a watch. This time, however, when you right-click the variable, choose View Memory of “variableName” from the menu. A new group called Memory will appear in the Debug navigator with the address you chose to view under it (Figure 17.17). When a memory address is selected in the Debug navigator for viewing, the memory’s contents are displayed in the Editor area (Figure 17.18).
Figure 17.17 A memory view added to the Debug navigator
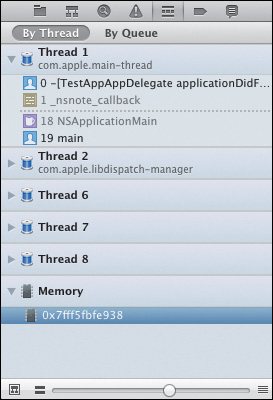
Figure 17.18 The memory view
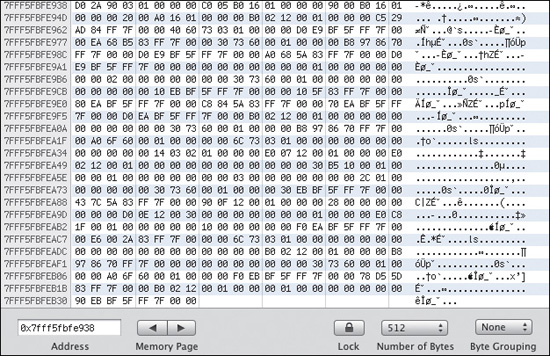
The view is manipulated via the controls at its bottom (Figure 17.19). The Address field shows the exact memory address the view will begin with. The Memory Page controls let you page forward and backward. The Number of Bytes control lets you adjust the memory page size you’re viewing. The Byte Grouping control lets you control how many bytes are grouped together as a single word.
Figure 17.19 The memory view controls

The Lock button’s behavior isn’t as intuitive as the rest. Your first thought might be that it locks the memory contents, preventing it from being modified. This is not the case. Instead, it lets you lock the current view of the contents from being updated. Since the memory view is normally updated as the memory changes, locking the display prevents it from being updated until you unlock it again. The memory continues to be changed (or not) as it normally would be while execution continues, but what’s displayed will remain the same as it was when you locked it.
Since the memory addresses are valid only while the application is running, all viewed addresses are removed from the Debug navigator when the debugging session ends. If you’d like to remove an address during the session, simply select it and press the Delete key.
Conferring with the Console
The debugger console is your command-line interface to the debugger. Whether you’re using GDB or LLDB, you can do more than read messages spat out by your applications. Both debuggers provide command-line interfaces to the same features that Xcode gives you graphically. Nevertheless, a few quick commands to the debugger via the console (Figure 17.20) can be helpful. Especially so if you want a text dump of the results.
Figure 17.20 The debugger console
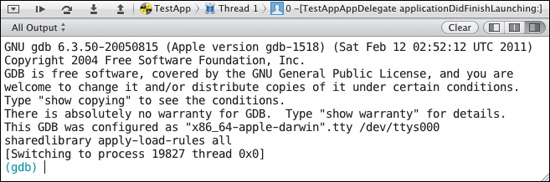
In order to issue commands to the debugger console, you must click inside the console window to place the cursor to the right of the debugger prompt ((gdb) or (lldb), depending on the debugger you’re using). The examples that follow will use GDB, as LLDB is still “under construction.”
Following are a few common tasks that can sometimes be done more easily with the console.
Note
As of this writing, LLDB is incomplete, and some commands that are available in GDB are not available or are incomplete in LLDB.
Printing Objects and Values
There are a few different ways to print objects and values from the console. The command you use depends on the kind of information you want to see.
Printing Objects
“Print object” (po) is the single most commonly used debugger command for Cocoa developers. The command will ask Objective-C objects to print the result of their common -description method. Inherited from NSObject, the method returns a string that describes the object. This description is intended to be useful for debugging. When the application is paused in the debugger, all the symbols in the current stack are available to you. This lets you issue a print object command to inspect objects (or other objects to which those objects hold references).
To print an object, you’ll need to pause the application in the debugger. Usually it’s most convenient to use a breakpoint. Once paused, find something interesting to print. Figure 17.21 shows TestApp paused once again in its -applicationDidFinishLaunching: method. This time, it’s paused below the line where you create an NSURL object and assign it to the googleURL variable, giving you a handy object to print. To print the object assigned to googleURL, type the following command into the console and press Return:
po googleURL
Figure 17.21 TestApp paused in the debugger
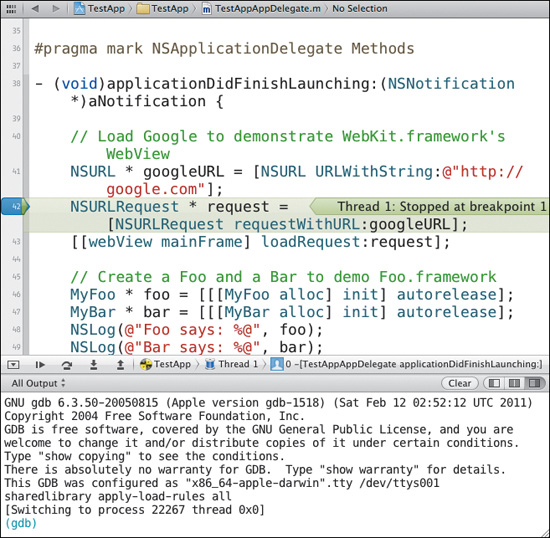
The debugger will respond by logging the string returned when the NSURL object is asked for its -description. Figure 17.22 shows the results in the debugger console.
Figure 17.22 Printing an object in the debugger console
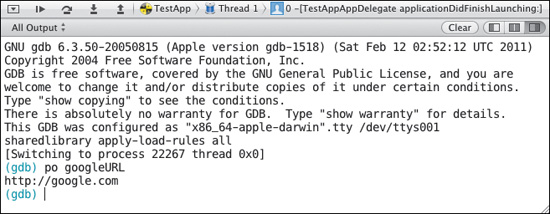
You can also print self when stopped within a method belonging to an instance of an Objective-C class. In the current scope of the example, self refers to an instance of the TestAppAppDelegate class. Figure 17.23 shows the result of printing self in this scope. In this case, the TestAppAppDelegate class doesn’t override -description, so the information displayed is the default description format inherited from NSObject. That is, the class name and address of the instance being printed are given.
Figure 17.23 Printing self
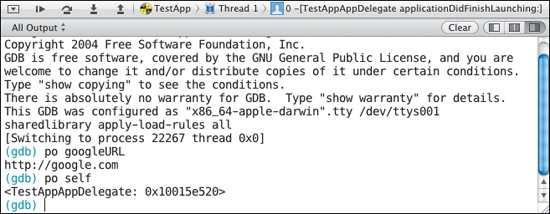
Of course you can also print objects through the accessors of other objects. For example, NSURL has a string property called -scheme. To print the scheme of the NSURL instance assigned to googleURL, you can issue the following command:
po [googleURL scheme]
The debugger calls the URL object’s -scheme method, then calls the returned object’s -description and prints this:
http
The information you see in the examples isn’t particularly exciting, but it can be enough to differentiate two similar objects inside a printed NSArray or NSDictionary object. While many objects in the Cocoa API come with reasonably useful descriptions, it’s up to the developer to override -description in their own objects and provide meaningful descriptions for their own debugging.
Printing Values
The po command works only on objects. What about values of primitives? What if you wanted to know the length of the string returned by the URL object’s scheme for some reason? You might expect the following command to work:
po [[googleURL scheme] length]
It won’t work because the -length method of NSString returns an NSUInteger—a primitive type, not an object. For primitive values, you use a different print command.
p (NSUInteger)[[googleURL scheme] length]
The debugger responds with this:
$1 = 4
There certainly are four characters in the string http. Let’s take a quick look at the structure of the command and its response.
The command p (short for print) expects the result of the statement you give it to evaluate ([[googleURL scheme] length]) to be cast to the expected type (NSUInteger) so it knows how to represent it. This type should be the return type of the method or function that ultimately returns the value (the outermost call in nested calls). In the case of NSString’s -length method, that’s an NSUInteger.
The response is actually more interesting than it looks. The debugger not only prints the result but kindly assigns it to a local variable for you to use in future evaluations. In this example, the number 4 (the length of the scheme string) was assigned to the variable $1. To use this is simple. Imagine you can’t work out in your head the math necessary to multiply the length by two. No problem! GDB can do it for you!
p (NSUInteger)($1 * 2)
GDB performs this complex computation and responds with:
$2 = 8
Notice how even that evaluation was assigned to a new variable, $2. There are many more tricks up print’s sleeves, which you can find at http://xcodebook.com/printf, but let’s move on.
Viewing the Backtrace
The backtrace in the current (paused) point in the application is the same information that is displayed under a paused thread in the Debug navigator: the stack. While Xcode’s user interface gives you nicely formatted information that can be used to navigate and control the debugging session, it’s not very handy for sharing information with others on a forum or mailing list, for example. It’s often helpful to be able to obtain a textual representation of the backtrace. Assuming TestApp is still paused in the same place as in the previous examples, issuing a backtrace command (bt for short) produces the following output:
#0 -[TestAppAppDelegate applicationDidFinishLaunching:] (self=0x10015e520, _cmd=0x7fff84ad29c5, aNotification=0x114029af0) at /Users/jnozzi/Path/To/TestApp Suite/TestApp/TestApp/TestAppAppDelegate.m:42
#1 0x00007fff83b568ea in _nsnote_callback ()
#2 0x00007fff835f1000 in __CFXNotificationPost ()
#3 0x00007fff835dd578 in _CFXNotificationPostNotification ()
#4 0x00007fff83b4d84e in -[NSNotificationCenter postNotificationName:object:userInfo:] ()
#5 0x00007fff83e3e3d6 in -[NSApplication_postDidFinishNotification] ()
#6 0x00007fff83e3e30b in -[NSApplication_sendFinishLaunchingNotification] ()
#7 0x00007fff83f09305 in -[NSApplication(NSAppleEventHandling)_handleAEOpen:] ()
#8 0x00007fff83f08f81 in -[NSApplication(NSAppleEventHandling)_handleCoreEvent:withReplyEvent:] ()
#9 0x00007fff83b84e42 in -[NSAppleEventManager dispatchRawAppleEvent:withRawReply:handlerRefCon:] ()
#10 0x00007fff83b84c72 in _NSAppleEventManagerGenericHandler ()
#11 0x00007fff88b50323 in aeDispatchAppleEvent ()
#12 0x00007fff88b5021c in dispatchEventAndSendReply ()
#13 0x00007fff88b50123 in aeProcessAppleEvent ()
#14 0x00007fff84e2c619 in AEProcessAppleEvent ()
#15 0x00007fff83e0e04b in _DPSNextEvent ()
#16 0x00007fff83e0d7a9 in -[NSApplication nextEventMatchingMask:untilDate:inMode:dequeue:] ()
#17 0x00007fff83dd348b in -[NSApplication run] ()
#18 0x00007fff83dcc1a8 in NSApplicationMain ()
#19 0x00000001000010c2 in main (argc=1, argv=0x7fff5fbff670) at /Users/jnozzi/Path/To/TestApp Suite/TestApp/TestApp/main.m:12
If you expand the frames under Thread 1 in the Debug navigator and then slide the detail slider all the way to the right (to reveal all stack frames), you’ll see that the information truly is the same. It’s nowhere near as pretty as what you see in Xcode’s UI, but it’s helpful when sharing your misery with other developers in hopes that they can help you.
Controlling Program Execution
You can control program execution from within the console just as you can by using the Debugger Bar or the menu system. This can be handy if you’re working heavily with the console. Here are a few basic commands:
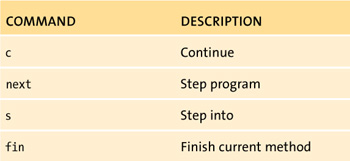
There are many more execution control commands but these are the basics you’re likely to need most. The debugger itself can offer help.
Code Completion
Recall from Chapter 7 that the Source Editor offers code completion, the ability for the editor to predictively suggest completions for the symbols you type. The debugger console offers limited support for this as well.
Getting Debugger Help
There are an impressive number of commands available in GDB (and the list is growing for LLDB as well, as its development progresses). Getting help with these commands is easy. Type help in the debugger and press Return for a list of categories of commands. Type help categoryname to list commands that fall under the named category. Type help commandname for help on the given command. To use one of the previous examples, type the following into the console:
help print
Here are the first few lines of the debugger’s response:
Print value of expression EXP.
Variables accessible are those of the lexical environment of the selected stack frame, plus all those whose scope is global or an entire file.
...
Remember to use the help command to find your way around the debugger’s toolkit.
Viewing Generated Output
The build process entails a number of steps. Along the way, your code is run through the preprocessor (covered in Chapter 19), where macros are expanded, includes are included, and so on. Further down the line, the assembly code is generated by the compiler. Xcode provides several ways to view this generated output.
Generating the Output Manually
You can generate and view this output at any time by choosing Product > Generate Output from the main menu. From there you can choose Generate Preprocessed File or Generate Assembly File. Xcode will produce the requested output and display it. Figure 17.24 shows the preprocessed result of TestAppAppDelegate.m.
Figure 17.24 Preprocessor output from TestAppAppDelegate.m
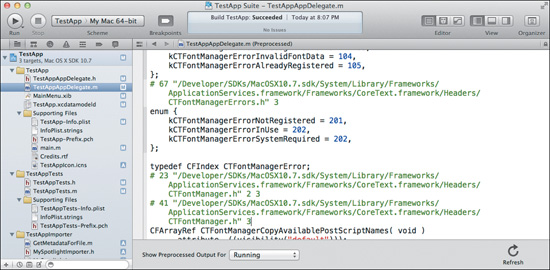
In Figure 17.24, content from all the included headers is shown. The toolbar at the bottom of the editor has two controls. The Refresh button forces the content to generate again. The pop-up lets you choose the build action for which to generate the output. This is helpful because of the differences between the various build actions (Running, Profiling, Archiving, and so on). Figure 17.25 shows the assembly code for the same file.
Figure 17.25 Assembly output from TestAppAppDelegate.m
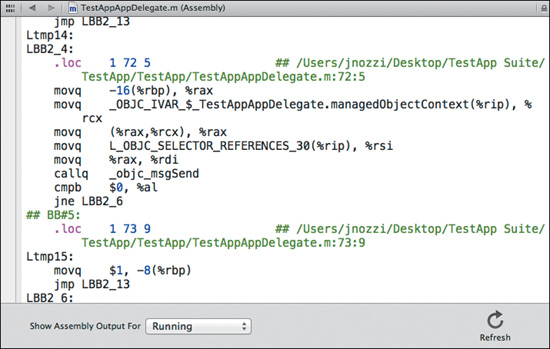
Using the Assistant
The Assistant editor can keep this output visible as well. Use the Generated Output mode, and select either Preprocessed content or Assembly content. When the debugger is paused you can see the disassembly as well by using the Assistant’s Disassembly mode (Figure 17.26).
Figure 17.26 Disassembly of TestAppAppDelegate.m
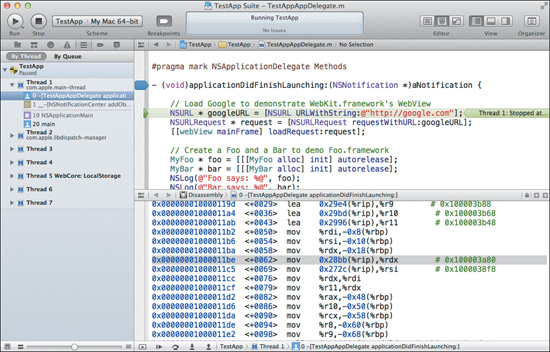
Debugging Apps for iOS Devices
Much of your Xcode exploration to this point has been done with a Mac OS X application because it’s simpler to demonstrate. If you happen to be an iOS developer (or plan to become one), however, this won’t work because of hardware differences. Your debugging, therefore, will have to be done using the iOS Simulator or a connected and provisioned iOS device.
For this demonstration, you’ll need to create an iOS project. Name it TestApp Touch. Refer to Chapter 2 to review how to create a new project. In the New Project template chooser (Figure 17.27), select the Application list under the iOS group, choose Tab Bar Application, and click Next. In the next sheet (Figure 17.28), specify the name and company identifier, leave the Device Family pop-up set to iPhone, do not include unit tests, and click Next. When prompted, save the project in the same folder in which your TestApp Suite workspace lives.
Figure 17.27 The New Project template sheet
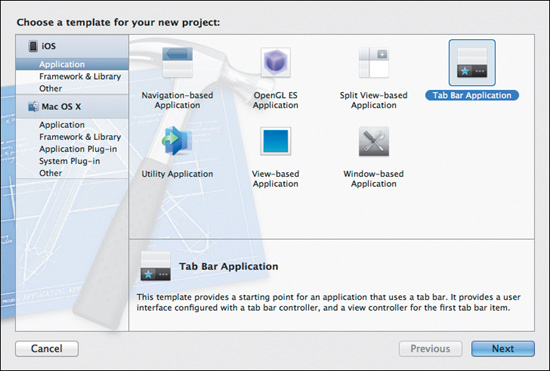
Figure 17.28 The iPhone project settings
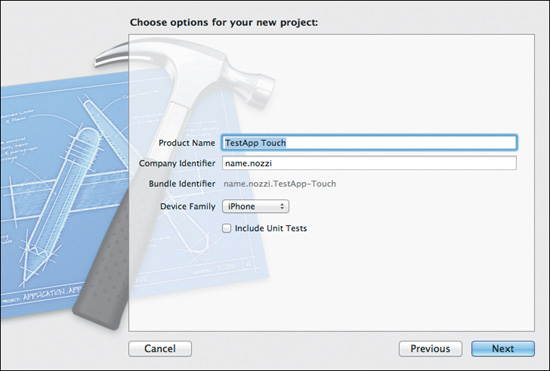
Note
You must be subscribed to Apple’s iOS Developer Program to test and debug applications on an iOS device. See Appendix A for details regarding provisioning your iOS device for development use.
When finished, you should have a new project just like Figure 17.29. At this point it’s a good idea to close the project to avoid confusion, navigate to it in Finder, and drag it into your TestApp Suite workspace as you learned to do in Chapter 16.
Figure 17.29 The new iPhone project
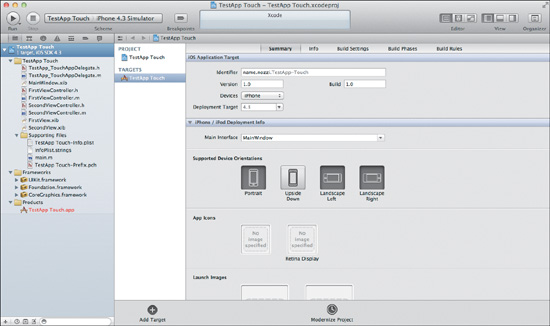
If you take a look at the Schemes pop-up, you’ll see at least two new run destinations (for the iPhone and iPad Simulators) for TestApp Touch (Figure 17.30). One simulates the iPhone and the other simulates the iPad. If you’ve already connected and provisioned any iOS devices (see Appendix A), those will show up as individual run destinations as well.
Figure 17.30 The Schemes pop-up with some new run destinations
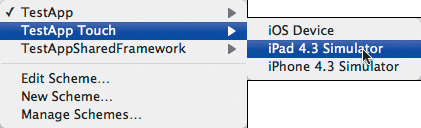
Quitting Applications
It may seem odd that there needs to be a section about quitting applications. The reason is that many new iOS developers become confused when they press the Home button on the device or Simulator but the application continues running in Xcode. This is because of how iOS handles applications when the Home button is pressed.
Applications in the most recent versions of iOS can be paused in the background (unless they opt out of this functionality). This means the application is still technically running, it’s just suspended. Unless your application opts out of being “backgrounded,” it won’t quit (and won’t end the Xcode debugging session) when you press the Home button.
There are two ways to quit an iOS application completely when you’re debugging it: Press Command+Q in the Simulator to quit the entire iOS Simulator, or click the Stop button in Xcode’s toolbar.
Using the iOS Simulator
You’re ready to run the iOS app in the iOS Simulator. You’ll need to make sure you’ve selected the TestApp Touch scheme with the iPhone Simulator run destination from the Schemes pop-up as shown in Figure 17.30. Now just run the application as you normally would—press the Run button or Command+R.
The Simulator application will launch and display a mock-up of an iPhone in which your application will then launch (Figure 17.31). Even with its two panels controlled by a tab bar at the bottom, the application isn’t particularly interesting, but it is functional.
Figure 17.31 TestApp Touch in the iOS Simulator
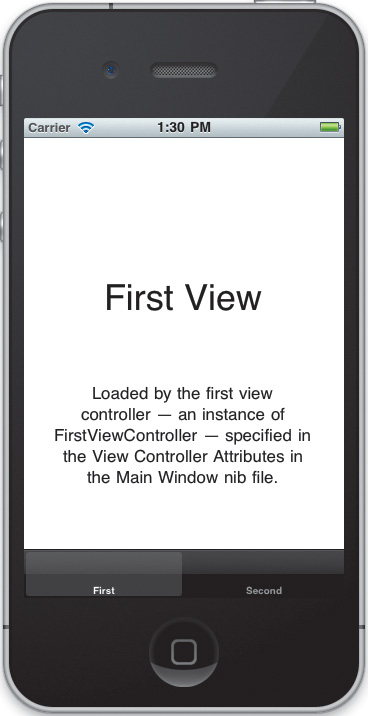
The Simulator is intended to be your primary testing and debugging environment, but testing on the device before deployment is not only highly recommended, it very well should be a law. Nevertheless, the Simulator needs to be able to simulate all the hardware, events, orientations, low memory warnings, and so on just as if the application were running on the device. Following are the main features you’ll need to understand.
Multi-Touch Events
One of the first questions the new developer will ask about the Simulator is how to generate multi-touch events. While all one-finger gestures are handled by clicking or dragging normally with your mouse pointer, two-finger events (such as spreading or pinching your fingers to zoom in or out) pose a challenge.
The iOS Simulator solves this problem nicely with the Option and Shift keys. Hold down the Option key while hovering your pointer over the simulated screen to reveal two dots (representing two fingers), as in Figure 17.32. Move the mouse around while holding the Option key to change the width between the “fingers” before clicking. Click and drag your mouse to begin the gesture; release to complete the gesture. If you need to move the two-finger gesture elsewhere (a zoomable view above an onscreen keyboard, for example), hold down the Option key as before but hold the Shift key as well to move both “fingers” together to a different part of the screen, releasing only the Shift key when you’ve finished moving the gesture location.
Figure 17.32 Two-finger gestures in the Simulator
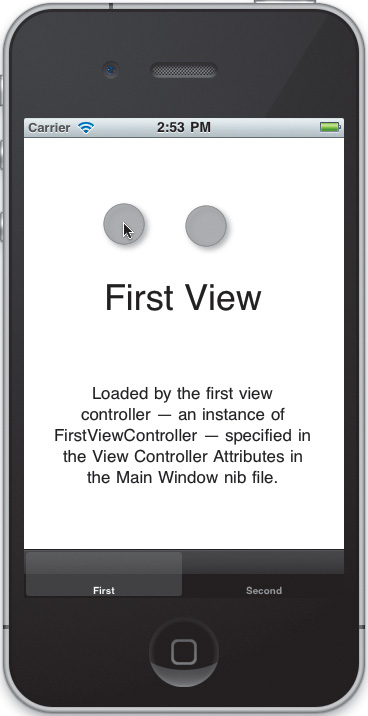
Devices and Versions
Xcode Tools comes with One iOS Simulator to Rule Them All. That is, the Simulator can be configured to simulate an iPhone, an iPhone at Retina display resolution, or an iPad. You can select the desired device from the main menu under Hardware > Device. You can select past iOS versions from the main menu under Hardware > Version.
Rotation
Because iOS devices are aware of their physical screen orientation, you need to be able to simulate the user rotating the device in order to test how your application responds to orientation changes (if your application supports that). Hopefully your application is more supportive than some parts of society are when people undergo orientation changes.
To change the device’s orientation, hold the Command key and press either the left or right arrow key. The simulated device will rotate in the direction you chose. If your application supports the various orientations, it should reshape its user interface automatically to fit the new orientation. If it doesn’t, you’ll see something like Figure 17.33.
Figure 17.33 Simulating device orientation changes (This app does not yet support orientation changes.)
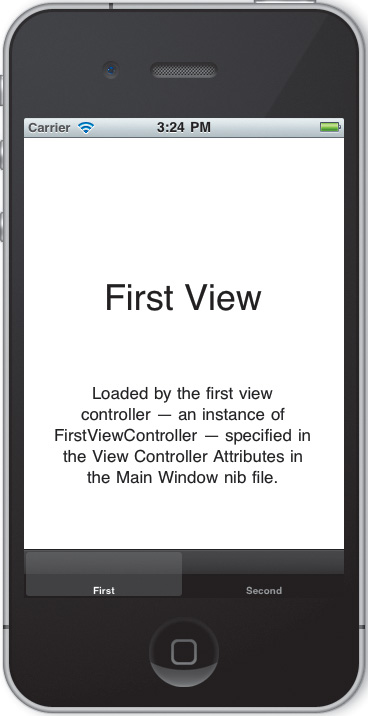
To support all orientations with this simple template application, you need to do two things. First, navigate to the project and select the TestApp Touch target from the Targets list. Under the Summary tab, make sure all buttons are selected under Supported Device Orientations (Figure 17.34). By default, only “Upside Down” is not selected as supported. Then, you’ll need to let the application’s view controllers (FirstViewController.m and SecondViewController.m) know that they’re allowed to auto-rotate to match any orientation. For each view controller file, find the -shouldAutorotateToInterfaceOrientation: methods and modify them to always return YES. Both files’ methods should look like the following code.
Figure 17.34 Setting the supported device orientations
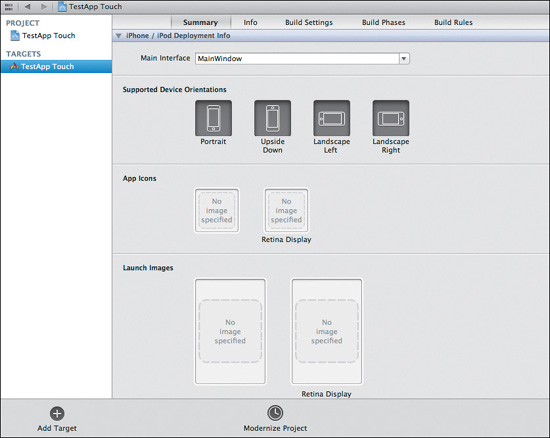
- (BOOL)shouldAutorotateToInterfaceOrientation: (UIInterfaceOrientation)interfaceOrientation
{
return YES;
}
Press the Stop button on Xcode’s toolbar if the application is still running, then run it again. Test the different orientations using Command and a right or left arrow key. The user interface should now rotate so that it is always upright no matter the orientation the Simulator shows (Figure 17.35).
Figure 17.35 TestApp Touch’s UI rotating to match the device orientation
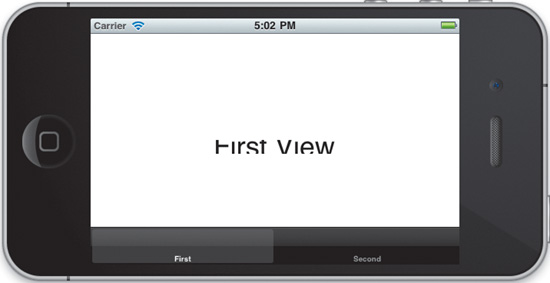
Note
The labels in the template view get “crushed” and do not display correctly in Figure 17.35. More work is needed to make certain all UI elements resize and move properly, but that topic is beyond the scope of this book. See the Cocoa documentation for details.
Simulating Common Device Events
There are several device events you’ll likely need to test.
Low Memory Warnings. First, an iOS application needs to handle low memory conditions properly. That is, unneeded resources should be released immediately when iOS tells your application the device is running low on memory. Failure to handle this event properly (or at all) will result in your application being terminated. Because you’re a good developer, you want to ensure that your application handles this event properly. You’ve implemented the correct method and called some application-specific memory cleanup code. Now you just need to test it to make sure it works. You can do so by choosing Hardware > Simulate Memory Warning from the main menu. You can even set a breakpoint on that method to make sure it’s called and to follow it through its instructions.
Shake. If you’ve used an iOS device, you know that many apps support “shake to undo,” which will trigger the application’s undo when the device is physically shaken. To trigger this event in the Simulator, choose Hardware > Shake Gesture from the main menu.
In-Call Status Bar. For iPhones, the UI must “squish down” to make room for the in-call status bar, which indicates that the phone is in a call while you’re using other applications. Because this affects your application’s user interface layout, it’s necessary to toggle the call bar to make sure your UI auto-sizes properly. You can do this by choosing Hardware > Toggle In-Call Status Bar from the main menu.
Simulating TV Out
Another popular iOS feature is the ability to connect external displays by using dock connector adapters. This lets you, for example, hook your iPad up to a projector and use Keynote for iPad to give a presentation, or to a television for a photo slideshow. Your app must provide this “TV Out” content, but you can test it in the Simulator without plugging anything in. To activate TV Out (which simulates an external display device being hooked up to the iOS device), select a resolution from the Hardware > TV Out menu under the main menu. To turn TV Out off, select Disabled from the same menu. Figure 17.36 shows the simulated iPhoto app in a slideshow, with a “starry sky” slide displayed in the TV Out viewer.
Figure 17.36 Simulating TV Out
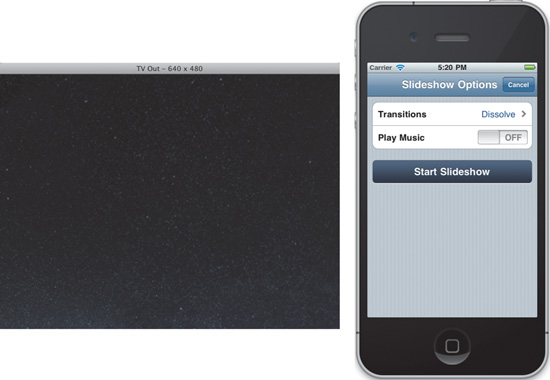
Using the Debugger
There’s nothing special required to use all of Xcode’s debugging facilities with the iOS Simulator. Breakpoints, the Debug navigator, and the Debug area all work in exactly the same way.
Debugging on iOS Devices
You just read that the debugger works as expected with the iOS Simulator. The same is true when debugging your applications on an iOS device as well. There are only a few differences.
Devices Must Be Provisioned
Your device must be provisioned for development. Please see Appendix A for more information regarding provisioning and managing your iOS devices.
Devices Must Be Unlocked
Your device must be unlocked. That is, if your device is passcode-protected and requires entering the passcode to unlock it for use, you’ll need to first unlock it before Xcode can use it for development. It must also remain unlocked for the duration of your debugging session.
Devices Must Remain Connected
You’ll need to leave the device connected. If you unplug the device during a debugging session, you won’t be able to reconnect during that session. You’ll have to stop the session in Xcode, make sure the device is plugged in again and that it is selected as a run destination in the Schemes pop-up (since it disappears when your device disappears), and then begin a new session.
Wrapping Up
You’ve learned a few more debugging tricks as well as how to debug your iOS applications on a device or using the Simulator. Xcode has plenty more debug-related features stuffed into various dark corners. Hopefully this chapter has illuminated the main aspects that most developers are looking for. In the next chapter, you’ll learn how to use Xcode’s unit testing facilities to catch as many bugs as you can before you need to debug them.
18. Unit Testing
Xcode has supported unit testing since version 2, but the developer community has often bemoaned the limits of that support. In Xcode 4, testing has become a first-class citizen, satisfying many of the previous complaints. In Chapter 14, you learned about the various Build actions, of which Test is one. When you call for a test (assuming you’ve set up unit testing), a testing-specific target is built and run, which in turn runs a series of tests against your code. In this chapter, you’ll explore Xcode’s unit testing features in greater detail.
What is Unit Testing?
Most sources define unit testing as a method of testing the functionality of individual units of code to make certain they work under any possible condition. Many developers define it as a royal pain in the butt (to put it mildly).
A unit is a single part of your code. Many describe a unit as a single function or method. As there tends to be a one-to-one relationship between a class in your code base and a matching class with which to test the first, some argue that the class is the unit. Either definition is saying more or less the same thing: A unit is a logical, testable piece of your code.
For example, if you have a MyCalculator class with methods that perform various calculations (such as additions, subtractions, factorials, or square roots), you might have a matching MyCalculatorTests class that tests each of those functions. Each test is typically its own method with a descriptive signature such as -testSquareRootOfNumber:, which does exactly as its name suggests.
Of course methods can pass objects back and forth, so you may have test cases that involve making sure that a valid object is returned from a method with various types of input under certain conditions, including verifying that no object is returned with certain input or conditions. For example, you may need to test a method that returns an object representing a network connection. The method may not be able to fulfill the request, either because you failed to provide it some valid input (such as a valid host name) or because of networking errors (such as an unplugged network cable or deactivated Wi-Fi connection).
The tests should be designed to cover all the imaginable ways the code could fail, to make sure that it doesn’t. No matter what changes you make to the code, the existing tests should still pass, and new tests (to cover new functionality or new scenarios) should pass, too.
The Benefits
Unit testing gives developers several clear advantages. The following are usually found at the top of the list.
Design
When software design is test-driven, the tests themselves are designed first and provide the goals for the software to meet. That is, if you design the tests to specify how the software should behave and then write the software with the intention of passing the tests, the developer knows that the design goals are met only when the code passes all the defined tests.
Change Management
Part of maintaining an application’s code base involves refactoring the existing code. With proper unit tests, a developer can make these changes confidently, re-running the tests after each change to verify that the code still meets the requirements the tests have set. The developer will know immediately whether their “new way of doing things” broke things when the test fails. Even better, well-designed unit tests tell the developer exactly where and why the new code failed.
Simplified Integration Testing
Integration testing is the testing of the various software components when brought together as a whole. For example, integration testing is done on the entire application to make sure all its parts work together properly. For this reason, integration testing is often done manually by people using the software. Unit tests ensure the individual components work properly, catching errors before they manifest as potentially confusing behavior to the user, leaving only integration-related problems for the tester to deal with. This clear delineation between “problem with component” versus “problem between components” simplifies the debugging process.
The Limitations
As mentioned, the biggest limitation with unit testing is that of scope. That is, unit testing only tests units. It does not cover problems that arise from integrating units. Other forms of testing (such as integration testing) are needed in conjunction with unit testing.
If that’s not enough to frighten you, consider what’s really needed to cover every possible aspect of a method. For each Boolean answer a method can give, you need at least two tests (one to test that the method answers true when it should, and one to test a proper no response). Properly designed test coverage usually requires several tests per method tested.
That’s not all. Not only must you design these tests but you must maintain them as the code changes, rewriting (or even simply renaming) them so they’re relevant as well as easily readable if they fail. For every new possibility that’s added to the unit, the test must cover it as fully as possible. Therefore, unit testing requires a great deal of engineering time and discipline to remain useful.
The Controversy
Developers tend to be an obsessive lot. We like the idea of unit testing. It’s neat, predictable, and verifiable. The trouble is, many of us admit we don’t unit test. The most often cited reason is the amount of work it takes to create and maintain the tests to maintain “full coverage” of all your code’s functions (and all the possible scenarios those functions may face). For independent software developers in particular, the engineering time proper unit testing takes may be unacceptable for a number of reasons.
Adding to the controversy is confusion over what exactly to test and how to test it. More specifically, those new to unit testing have trouble determining how to design the tests for their code. That particular subject is well beyond the scope of this book, so this chapter will focus on the tools Xcode provides, leaving the study of unit test design for a better-suited book. Whether or not unit testing is for you (and how best to approach it for your project) is up to you to explore.
Unit Testing in Xcode
As you saw in Chapter 14, Xcode provides a specific Build action called Test (which you can initiate by pressing Command+U or by choosing Product > Test from the main menu). You can see the tests that are to be run for the active scheme in the scheme’s Test action (Figure 18.1). These tests are automatically detected based on their formatting, which you’ll learn later in this chapter.
Figure 18.1 The default tests in the Scheme Editor
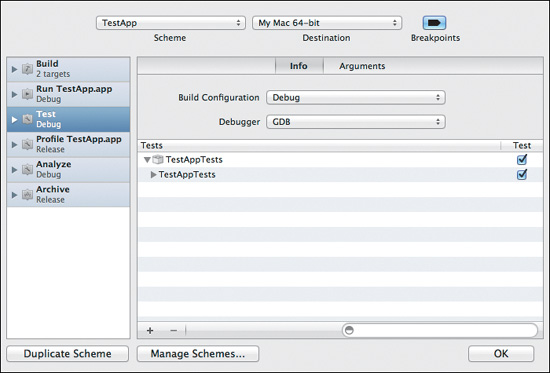
Recall that you chose to include unit tests when you created the familiar TestApp project. Because of this, the TestAppTests target was created for you automatically and was added to the scheme. Contrast this with the TestAppSharedFramework scheme, where no unit tests were added (Figure 18.2).
Figure 18.2 No tests defined for the TestAppSharedFramework scheme
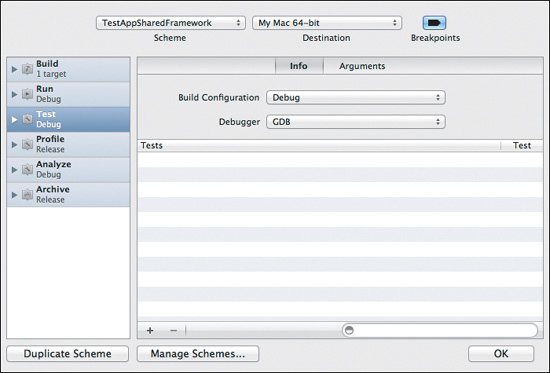
In Figure 18.1, the TestAppTests target is expanded, showing another node called TestAppTests. This corresponds to the only file that belongs to the TestAppTests target: TestAppTests.m. The TestAppTests class defined in its .m file defines the individual tests available (in the form of methods). Were there any test methods defined in that class, those method names would show up under the class name in the scheme’s Test action automatically. The Test column lets you toggle individual tests on or off.
Note
The TestAppTests.m file is located in the TestAppTests group in the Project navigator. This is automatically created for you when you include unit tests when creating a new project. The file itself is a generic place to run tests, but best practice is to create a matching test class for each class in your code base.
In their current state, the template-supplied tests aren’t particularly helpful. When you test TestApp now, the last line of the results (found in the Log navigator) shows zero unexpected failures—a clean test. Obviously it’s only a clean test because nothing was really tested. You’ll explore the test result logs in more detail later in this chapter.
Powered by OCUnit
It’s important to know that Xcode uses OCUnit, part of the SenTestingKit framework. OCUnit provides the test management and interface code, the Cocoa Unit Testing Bundle target template, and the Objective-C test case class template.
Test Targets and Classes
The target links against SenTestingKit.framework. In its Compile Sources build phase, it contains not only the .m files of its test classes but those of the classes they test (since they must be compiled and linked so the test classes can use them).
The test classes, as mentioned above, can be created using the Objective-C test case class template (accessed from the Add Files panel or by dragging the template file into the project from the File Template library, as in Figure 18.3).
Figure 18.3 The File Template library
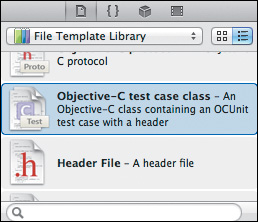
Again, it’s important to note that the test case classes and the classes they test against must be added to the unit test target. The test case classes are subclasses of the SenTestCase class provided by SenTestingKit.framework. The test case class template provides basic stub methods for setup and tear-down of the testing environment. Beyond that, it’s up to you to add individual tests in the form of methods. Test case classes are created for each class in your code base.
Tip
You can learn more about OCUnit by visting www.sente.ch/software/ocunit.
Asserting Yourself
Tests ultimately pass or fail an assertion. Depending on what you’re testing, you will assert that a condition must be satisfied. For example, you may assert equality with an expected value, or that an exception must or must not be raised, or that a return value must or must not be nil. Following are some of the assertions provided by OCUnit with descriptions and basic example code for each.
STAssertEqualObjects() generates a failure if the two objects passed to it are not equal.
STAssertEqualObjects(objectA, objectB, @"One of these objects is not like the other.");
STAssertEquals() generates a failure if the two scalars, structs, or unions passed to it are not equal.
STAssertEquals(myValue, kSomeConstant, @"myValue should be %f but it's %f. My world view is shattered.", myValue, kSomeConstant);
STAssertEqualsWithAccuracy() generates a failure if two scalars are not equal to within some accuracy. In other words, if the accuracy is .1, the values 0.9 and 1.0 would be considered equal. The primary use is for float or double scalars but works for others.
STAssertEqualsWithAccuracy(piCloseEnough, M_PI, 0.005, @"piCloseEnough (%f) isn't close enough to pi for our tastes. Mmm. Tasty pi.", piCloseEnough);
STFail() generates an unconditional failure. It’s useful for those edge cases the other assertions do not cover, as well as for cases where a certain block of code should never be reached (the line after a while loop that’s not intended to be broken, for example).
STFail(@"Error: Hamster should not float; Q has changed the gravitational constant of the universe.");
STAssertNil() generates a failure if the passed object is not nil.
STAssertNil(someNilObject, @"How exactly do you get something from nothing?");
STAssertNotNil() generates a failure if the passed object is nil.
STAssertNotNil(aValidObject, @"I visited this method and all I got was this lousy nil.");
STAssertTrue() generates a failure if the passed Boolean (BOOL) expression evaluates to false.
STAssertTrue((M_PI == 3.0f), @"Professor Frink says pi is exactly three!");
STAssertFalse() generates a failure if the passed Boolean (BOOL) expression evaluates to true.
STAssertFalse((1 == 1), @"We don't BELIEVE in equality 'round THESE parts, stranger!");
STAssertNoThrow() generates a failure if the expression throws an Objective-C exception.
STAssertNoThrow([someCalculatorObject addOneToThree], "The answer is 4, you dolt. What went wrong?");
STAssertThrows() generates a failure if the expression does not throw an Objective-C exception.
STAssertThrows([someCalculatorObject divideByZero], @"Wait, what? What result did YOU get?!");
Each test should contain at least one assertion. Some argue that each test should include only one assertion so that the test’s name (the method signature) is precisely descriptive of what is being tested, making the precise failure easier to identify should it arise.
Test Results Log
As mentioned previously, the test result output shows up in the Log navigator. Following is the output from the first run of the TestApp scheme’s Test action.
GNU gdb 6.3.50-20050815 (Apple version gdb-1518) (Sat Feb 12 02:52:12 UTC 2011)
Copyright 2004 Free Software Foundation, Inc.
GDB is free software, covered by the GNU General Public License, and you are welcome to change it and/or distribute copies of it under certain conditions.
Type "show copying" to see the conditions.
There is absolutely no warranty for GDB. Type "show warranty" for details.
This GDB was configured as "x86_64-apple-darwin".tty /dev/ttys000 sharedlibrary apply-load-rules all
[Switching to process 12421 thread 0x0]
objc[12421]: GC: forcing GC OFF because OBJC_DISABLE_GC is set
Test Suite 'All tests' started at 2011-04-13 20:02:20 -0400
Test Suite '/Developer/Library/Frameworks/SenTestingKit. framework(Tests)' started at 2011-04-13 20:02:20 -0400
Test Suite 'SenInterfaceTestCase' started at 2011-04-13 20:02:20 -0400
Test Suite 'SenInterfaceTestCase' finished at 2011-04-13 20:02:20 -0400.
Executed 0 tests, with 0 failures (0 unexpected) in 0.000 (0.000) seconds
Test Suite '/Developer/Library/Frameworks/SenTestingKit. framework(Tests)' finished at 2011-04-13 20:02:20 -0400.
Executed 0 tests, with 0 failures (0 unexpected) in 0.000 (0.001) seconds
Test Suite '/Users/jnozzi/Library/Developer/Xcode/DerivedData/TestApp_Suite-gjvjpbtynoofyphkphrqcobvoibi/Build/Products/Debug/TestAppTests.octest(Tests)' started at 2011-04-13 20:02:20 -0400
Test Suite 'TestAppTests' started at 2011-04-13 20:02:20 -0400
Test Suite 'TestAppTests' finished at 2011-04-13 20:02:20 -0400.
Executed 0 tests, with 0 failures (0 unexpected) in 0.000 (0.000) seconds
Test Suite '/Users/jnozzi/Library/Developer/Xcode/DerivedData/TestApp_Suite-gjvjpbtynoofyphkphrqcobvoibi/Build/Products/Debug/TestAppTests.octest(Tests)' finished at 2011-04-13 20:02:20 -0400.
Executed 0 tests, with 0 failures (0 unexpected) in 0.000 (0.001) seconds
Test Suite 'All tests' finished at 2011-04-13 20:02:20 -0400.
Executed 0 tests, with 0 failures (0 unexpected) in 0.000 (0.002) seconds
The first 17 lines can usually be ignored, as they relate to the success or failure of the testing environment itself. As you see on line 11 (the first line starting with “Test Suite...”), suites are started and finished and the number of failures is reported.
Navigable Errors
Testing offers more than just logging. Upon encountering a failure, the point of failure is highlighted as an error in the Source Editor. Figure 18.4 shows a simple (if contrived) test that asserts that the BOOL value YES should be equal to NO—a guaranteed failure. Upon testing, this failure was flagged as an issue that can be navigated like any other.
Figure 18.4 A test error displayed in the editor
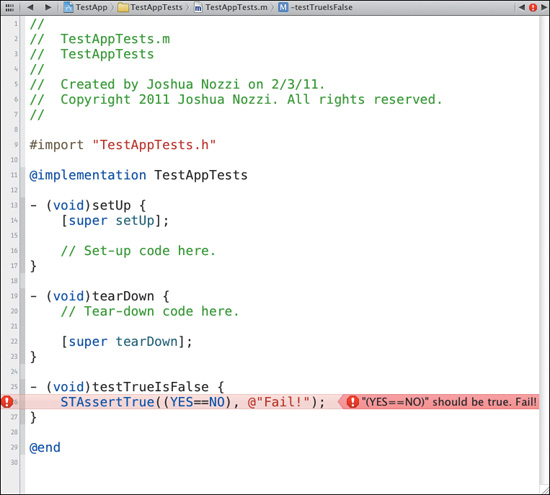
Just as interesting, the Issue navigator (Figure 18.5) dutifully displays not only the test failure, but a description of the nature of the failure (based on the type of assertion you used) and the custom message if you provided one.
Figure 18.5 A test error displayed in the Issue navigator
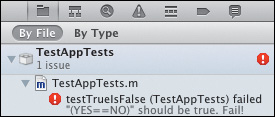
Writing a Unit Test
To create an appropriately illustrative unit test for TestApp, you’ll need to create something easily tested, design the test based on what you know must work, and then write the test to those specifications. In the following sections, you’ll do just that using a very simple Person class.
Creating Something Testable
You’ll start by adding a Person class to TestApp. To do so, add a new Objective-C class to the project (to the TestApp target) by choosing File > New > New File from the main menu. Name the class Person and make it a subclass of NSObject. Make certain before saving that the new Person class is added to both the TestApp and TestAppTests targets (Figure 18.6) so it can be used by the test case you’ll write shortly. Click Save to add the file.
Figure 18.6 Adding a Person class
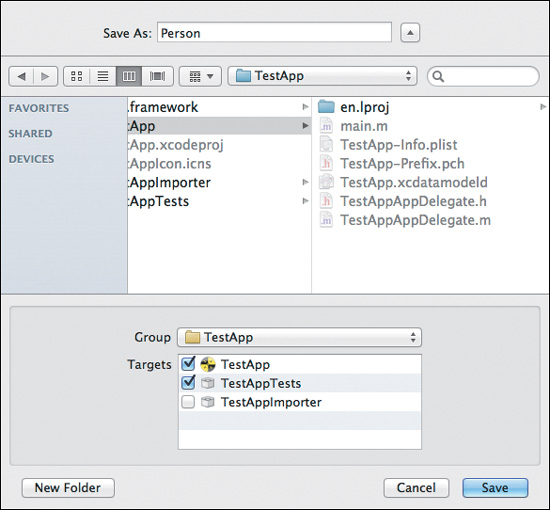
Build a basic Objective-C class using the code below. Replace the entire contents of your Person.m file with the following code:
#import "Person.h"
@implementation Person
- (id)init
{
self = [super init];
if (self)
{
firstName = nil;
lastName = nil;
}
return self;
}
- (void)dealloc
{
[firstName release];
firstName = nil;
[lastName release];
lastName = nil;
[super dealloc];
}
@synthesize firstName;
@synthesize lastName;
@end
Then, replace the contents of your Person.h file with the following code:
#import <Foundation/Foundation.h>
@interface Person : NSObject {
NSString * firstName;
NSString * lastName;
}
@property (nonatomic, retain) NSString * firstName;
@property (nonatomic, retain) NSString * lastName;
@end
This code describes a basic class representing a person with a first and last name. Assuming you’re familiar with Objective-C, you’ll realize the two name properties will be nil when the person is first created. Additionally, the synthesized accessors for those properties will allow the names to be set to nil or an NSString (which could be empty). These are scenarios you should avoid—a person should always have a first and last name, even if created without a first and last name. For that, you need to design a test.
Designing the Test
Your goal for the Person test coverage is simple: All Person instances must have a valid first and last name. That is, they cannot have nil or an empty NSString set as their first or last name, nor can the Person instance be initialized in such a state. All tests must be contained within their own method and must begin with - (void)test...
For minimal coverage, you need four tests: testLastNameCannotBeNil, testLastNameCannotBeEmptyString, testFirstNameCannotBeNil, and testFirstNameCannotBeEmptyString.
You already know that all four tests will fail with the Person class in its current state. There is no code to check for and enforce these requirements. Time to write the test.
Writing the Test
To write the test, you’ll need to add an Objective-C test case class to the project. You can do this by dragging an Objective-C test case class from the File Template library into the Project navigator (under the TestAppTests group), as seen in Figure 18.7.
Figure 18.7 Adding a test case class to the project
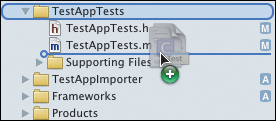
Name the class PersonTest.m so it’s clear to which class this test belongs. Also add the test only to the TestAppTests target (since it does not need to be built for TestApp to run). Your settings should resemble Figure 18.8. Click Save.
Figure 18.8 Naming and configuring the test case class
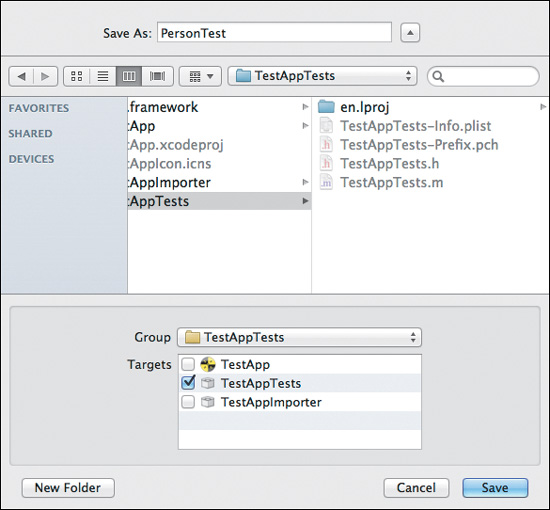
Replace the contents of PersonTest.m with the following code:
#import "PersonTest.h"
#import "Person.h"
@implementation PersonTest
@synthesize personToTest;
- (void)setUp {
[super setUp];
// Create a person to test
Person * newTestPerson = [[Person alloc] init];
[self setPersonToTest:newTestPerson];
[newTestPerson release];
}
- (void)tearDown {
// Kill the test person
[self setPersonToTest:nil];
[super tearDown];
}
- (void)testLastNameCannnotBeNil
{
self.personToTest.lastName = nil;
STAssertNotNil(self.personToTest.lastName, @"Last name cannot be nil!");
}
- (void)testLastNameCannnotBeEmptyString
{
self.personToTest.lastName = @"";
STAssertTrue((self.personToTest.lastName.length > 0), @"Last name cannot be empty string.");
}
- (void)testFirstNameCannnotBeNil
{
self.personToTest.firstName = nil;
STAssertNotNil(self.personToTest.firstName, @"First name cannot be nil!");
}
- (void)testFirstNameCannnotBeEmptyString
{
self.personToTest.firstName = @"";
STAssertTrue((self.personToTest.firstName.length > 0), @"First name cannot be empty string.");
}
@end
Replace the contents of PersonTest.h with the following code:
#import <SenTestingKit/SenTestingKit.h>
@class Person;
@interface PersonTest : SenTestCase {
Person * personToTest;
}
@property (nonatomic, retain) Person * personToTest;
- (void)testLastNameCannnotBeNil;
- (void)testLastNameCannnotBeEmptyString;
- (void)testFirstNameCannnotBeNil;
- (void)testFirstNameCannnotBeEmptyString;
@end
If you look in the Scheme Editor for the TestApp scheme, under the Test action, you should now see your four new tests being picked up under the new PersonTest entry there (Figure 18.9).
Figure 18.9 The Test action populated with the new tests
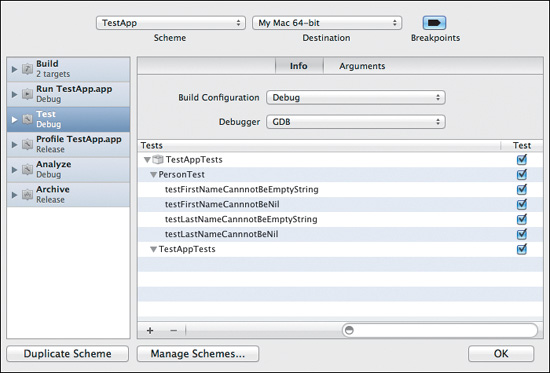
Testing the Test
It’s now time to make sure your test works properly. Make sure the TestApp scheme is active, and press Command+U or choose Product > Test from the main menu. When you do, you’ll get four expected failures. They’ll be highlighted in the editor as well as listed neatly in the Issue navigator (Figure 18.10).
Figure 18.10 Expected failures in the Issue navigator
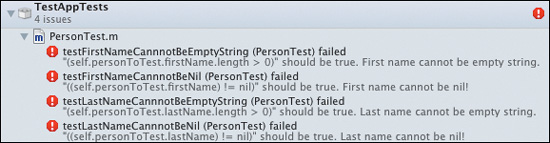
Tip
You might try disabling one of the tests in the Scheme Editor’s Test action panel by deselecting the Test check box next to the desired test. Run the test again, and you’ll see that failure missing from the list because that test was not executed.
Passing the Test
To pass the test, your Person class clearly needs to guard against nil or blank names. Not only does it need smarter setter accessors but some default values in the -init method as well. Replace the entire contents of Person.m with the following code:
#import "Person.h"
@implementation Person
- (id)init
{
self = [super init];
if (self)
{
self.firstName = @"John";
self.lastName = @"Smith";
}
return self;
}
- (void)dealloc
{
[firstName release];
firstName = nil;
[lastName release];
lastName = nil;
[super dealloc];
}
- (NSString *)firstName
{
return firstName;
}
- (void)setFirstName:(NSString *)newFirstName
{
if (firstName != newFirstName &&
newFirstName &&
newFirstName.length > 0)
{
[firstName release];
firstName = [newFirstName retain];
}
}
- (NSString *)lastName
{
return lastName;
}
- (void)setLastName:(NSString *)newLastName
{
if (lastName != newLastName &&
newLastName &&
newLastName.length > 0)
{
[lastName release];
lastName = [newLastName retain];
}
}
@end
The changes to Person.m ensure several things. First, that the -init method always makes sure there’s a default first and last name. Second, that the custom accessor methods (the setters in particular) make sure the newly passed name is neither nil nor an empty NSString.
Now you can check to make sure the code works as desired by repeating the tests. This time, all four tests should pass. Press Command+U to run the unit tests and notice happily that no errors come up in the Issue navigator. You can further verify the tests passed by finding the test results in the Log navigator.
You can see that the tests were run and were individually successful with the following lines in the log:
Test Case '-[PersonTest testFirstNameCannnotBeEmptyString]' started.
Test Case '-[PersonTest testFirstNameCannnotBeEmptyString]' passed (0.000 seconds).
Test Case '-[PersonTest testFirstNameCannnotBeNil]' started.
Test Case '-[PersonTest testFirstNameCannnotBeNil]' passed (0.000 seconds).
Test Case '-[PersonTest testLastNameCannnotBeEmptyString]' started.
Test Case '-[PersonTest testLastNameCannnotBeEmptyString]' passed (0.000 seconds).
Test Case '-[PersonTest testLastNameCannnotBeNil]' started.
Test Case '-[PersonTest testLastNameCannnotBeNil]' passed (0.000 seconds).
The summary of the PersonTest tests is as follows:
Executed 4 tests, with 0 failures (0 unexpected) in 0.000 (0.000) seconds
Congratulations! You’ve just passed your first code-driven design-and-test cycle.
Adding Unit Tests to Existing Projects
Not every project you’ll be working with in Xcode 4 will come from Xcode 4. For older projects (or even new projects in which you forgot to include the default unit testing support), you may have to add this capability yourself.
The perfect candidate is the TestApp Touch project you created in Chapter 17 because you did not request unit tests be created along with the project. To add a unit test target, select the TestApp Touch project in the Project navigator and then choose File > New > New Target from the main menu. Since it’s an iOS project, choose the Other subcategory under the iOS category. Select the Cocoa Touch Unit Testing Bundle option (Figure 18.11). Press Next.
Figure 18.11 Choosing the testing bundle
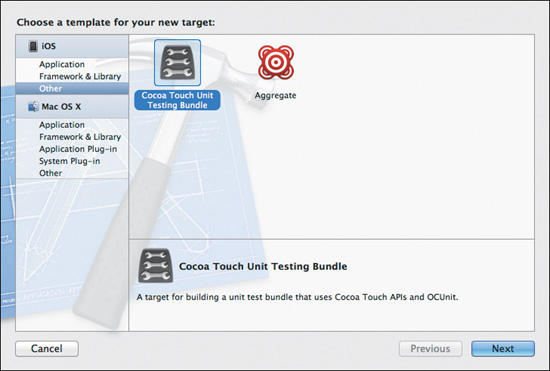
On the next sheet, give the target a useful name, like TestAppTouchTests. Your settings should resmble Figure 18.12. Click Finish to add the new target.
Figure 18.12 Configuring the testing bundle
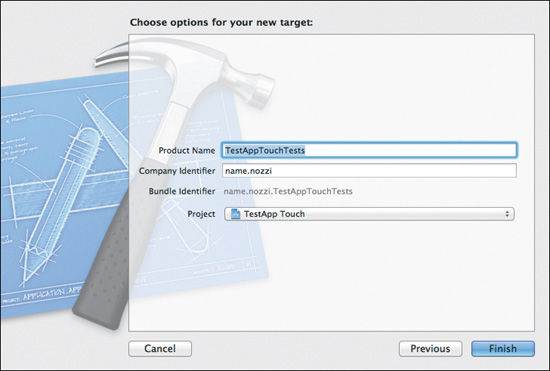
The next step is to set up the TestApp Touch scheme to recognize the test bundle. Open the Scheme Editor for the TestApp Touch scheme and select the Test action. The list of tests should be empty, as in Figure 18.13.
Figure 18.13 No test bundle yet in the Test action
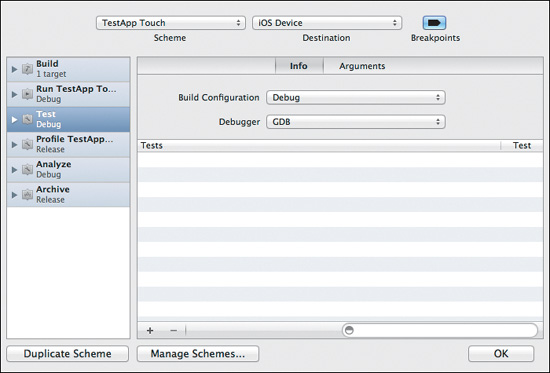
Press the Add (+) button at the bottom of the list to reveal a sheet (Figure 18.14) from which you can select test bundles to add. Choose TestAppTouchTests and click Add.
Figure 18.14 Adding the test bundle target
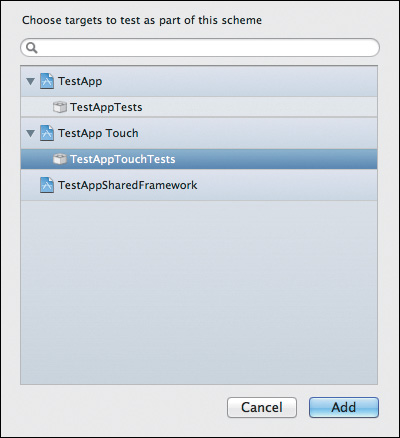
You should now see the TestAppTouchTests test target in the list, along with its default test class and example test (Figure 18.15). From there, you can continue adding test case classes and building your tests as you’ve just learned to do.
Figure 18.15 The newly added test target, ready for tests
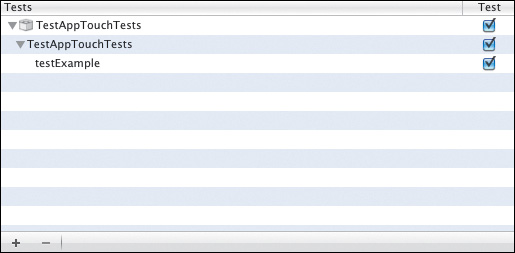
Wrapping Up
Whatever your feelings about unit testing, you cannot argue that Xcode 4 doesn’t make it easy to set up and use. Of course, designing tests properly, as well as taking the time to maintain them, relies on your own discipline. In the next chapter, you’ll learn to take advantage of Xcode 4’s various hooks and facilities for extending and customizing the build process.
19. Using Scripting and Preprocessing
This chapter is about using scripting as well as the preprocessor to customize the build process. One size most certainly does not fit all coding environments, and large groups as well as independent developers can take advantage of Xcode’s scripting and preprocessing capabilities to automate a variety of testing and deployment tasks.
This chapter will not serve as an exhaustive list of everything you can achieve—that would be an entire book unto itself. Instead, the goal is to introduce you to the scripting hooks and to some preprocessor tricks to spark your imagination so you will be better equipped to dream up your ideal automation pipeline.
Extending Your Workflow with Custom Scripts
In Chapter 14, you explored Xcode’s redesigned build system. You learned that there are separate build actions that are run against the active scheme. You also learned that the action you perform will automatically build the specified targets in the way that makes the best sense for that action (a build for running yields a Debug build; a build for archiving yields a Release build). Two important features were mentioned briefly: the ability to run scripts before and after each type of action and the ability to run a script as part of a build phase.
Scripting Opportunities
Xcode offers several opportunities to hook in your custom scripts to extend functionality. Xcode has always come with the Run Script build phase (see Chapter 14), but Xcode 4 adds pre- and post-action scripts, which are run before and after each major action (such as Build, Run, Archive, and so on).
Pre- and Post-Action Scripts
In Chapter 14, you learned about the Run Script build phase, which, as its name suggests, runs the specified script when the target to which it belongs is built. The limitations of such a script are the same as its benefits: It runs only when its target is built. The ability to run a script just before (or after) a Run action, however, would let you reset the application’s test data before launch to always run against the same test data (or clean up a mess after the app finishes running). A bit of postprocessing for an archive created by the Archive action would be helpful for many developers as well. For each build action (Build, Run, Test, Profile, Analyze, and Archive), you can run a custom script before and after. These are called pre-action and post-action scripts.
To manage pre- and post-action scripts, you edit the scheme into which you want to place them. From there, you select the action and expand it by clicking the disclosure button and selecting Pre-actions or Post-actions. Figure 19.1 shows the post-action editor for the Run action of the TestApp scheme.
Figure 19.1 The pre-/post-action editor
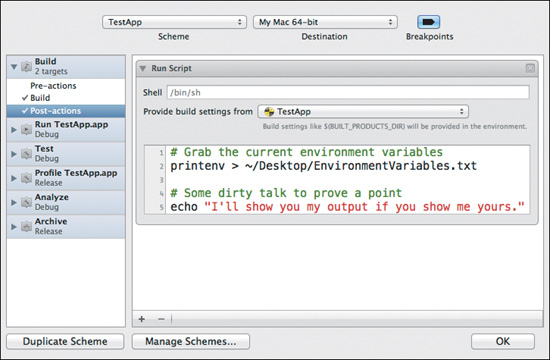
The nomenclature is a bit messy: A post-action script action for the Build action could be called a “post-Build-action action.” Whatever you choose to call them, actions (pre- or post-) are added and removed using the Add (+) and Remove (–) buttons. There are currently two types of actions: Run Script and Send Email. We’ll ignore the obvious mail-sending feature in favor of the considerably more powerful scripting capabilities.
The Run Script action has three controls. The Shell field lets you specify a path to a specific scripting shell. The default is /bin/sh. The pop-up menu lets you choose the source of the environment variables supplied to your scripting environment. For example, BUILT_PRODUCTS_DIR always points to the folder into which the target’s built products are placed. The pop-up lets you choose the target from which these variables are populated, or no target at all. The third control is a small script editor.
Figure 19.1 shows that the script does two things. It prints the environment variables to a file named EnvironmentVariables.txt on the current user’s desktop, then rather salaciously sums up a script output problem, which you’ll explore in a moment. If you have any shell scripting experience at all, you’re likely already imagining many ways to take advantage of these additional scripting hooks. Your delight will last to the beginning of the paragraph.
Unfortunately, this neat feature comes with a big disappointment. At the time of this writing, the standard output from these scripts seems to show up wherever it pleases, depending on the build action to which it belongs (and possibly the phase of the moon—further testing is necessary). A quick look at Figure 19.2 shows that a search of the build log—a good place for post-Build-action-script action standard output—produces no results.
Figure 19.2 Disappointing log search results
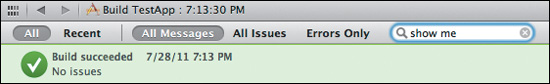
Output from Build action scripts gets shunted to the system console log but seems to appear nowhere else, whereas Run action output shows up in the debugger console as well as the system console. Test output shows up in the system console log but not in the test log in the Log navigator, nor in the debugger console. Profile and Archive output appears only in the system console log, while the Analyze pre- and post-actions are entirely unavailable (though they appear in the editor and Issue navigator UI). If you’re confused by this, you’re in good company.
Note
This feature is more than likely a still-undercooked part of Xcode 4 that will be improved. For now, if you need consistent standard output logging for these scripts, you’re out of luck. More than likely, an Xcode update just prior to publication will force this author to eat his words. His salt and pepper are standing by.
Run Script Build Phases
Despite the preceding doom and gloom, there is still the tried-and-true Run Script build phase, which you learned about in Chapter 14. Its output is easily located, and it offers an impressive array of environment variables. You can add as many as you like to the build phases of a given target. Figure 19.3 shows an empty Run Script build phase added to the TestApp target and expanded to show its settings. Run Script scripts are executed in the order in which they appear in the target’s build phases list.
Figure 19.3 An empty Run Script build phase
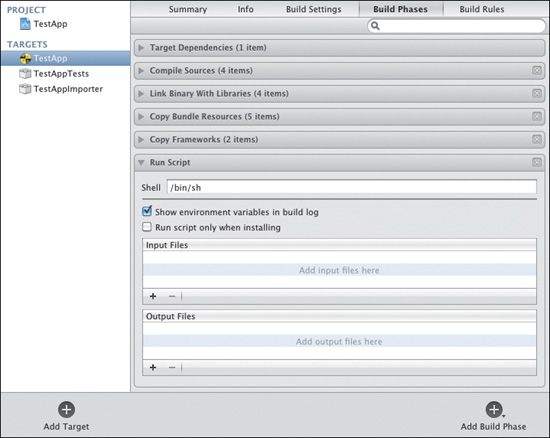
The Shell field lets you specify the shell you want to use to execute the script. The default is /bin/sh. Alternatives are bash (the default shell for Mac OS X), perl, python, or any installed scripting environment.
The editor area directly beneath the Shell field will contain your script. You can type or paste a script directly into the field or drag a script file from your workspace. Since the field grows to match the size of your script, you’ll likely find it easier to take the drag-a-script-file-from-your-workspace approach. To do so, add a new shell script file to your workspace from the template (Figure 19.4). You can then drag the script into the script editor field. This way you can edit your script in the Source Editor, which causes the build phase to call your script when executed.
Figure 19.4 The shell script file template
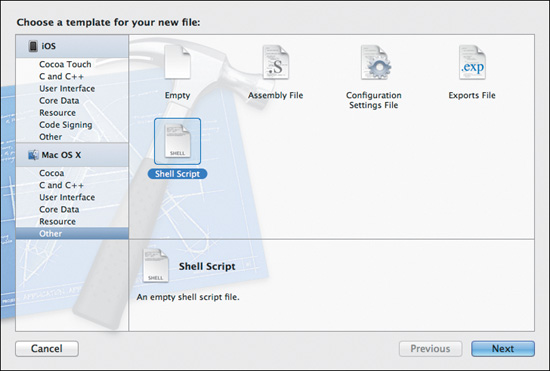
Note
When dropping a script from your workspace into the script editor, Xcode inserts the full path to your script file. This essentially creates a script whose only purpose is to call the script in your workspace. The inserted path is absolute, however, and will break if you move your project to another folder or disk. You may want to use a relative path instead.
The “Show environment variables in build log” check box (Figure 19.3) is a handy option for debugging your script to make sure the variables you use have the values you expect. When this check box is selected, the environment variables available to the shell will be included in the build log. But you can safely turn off this option without affecting the script’s environment and cut down on the build log size.
When the “Run script only when installing” check box is selected, the script will be executed only when both the Installation Directory build setting is set to a valid path and the Deployment Location build setting is set to Yes for the current configuration (triggering an “install build”).
Xcode’s Environment Variables
Xcode provides a number of environment variables that contain information useful to your scripting endeavors. For example, it may be important to know the path to a built product or to some resource that is external to the project but relative to the project’s folder. It might also be useful to know what build configuration is being used or what install directory is specified in the build settings.
This build environment information is invaluable when using scripts to extend the build process with your own postprocessing.
Getting At the Variables the Dirty Way
You can employ a trick to get a quick list of the environment variables used in your project as well as their values at build time. The trick is particularly devious because it uses a build script itself. If you’re familiar with Unix, you might be aware of the printenv command, which prints the current environment variables and their values.
To use this trick, just add a Run Script build phase to the TestApp target. Recall that to do this, you must navigate to the TestApp project, select the TestApp target, and then click the Build Phases tab. Using the Add Build Phase button at the bottom of the window, choose Add Run Script. Add the following to the script editor in the Run Script phase controls:
printenv > ~Desktop/XcodeBuildEnvironmentVariables.txt
Your Run Script phase should look like Figure 19.5. Build the application (press Command+B to force a build). The text file you asked for (XcodeBuildEnvironmentVariables.txt) should appear on your desktop. Open it and take a look.
Figure 19.5 A script to print environment variables to a text file
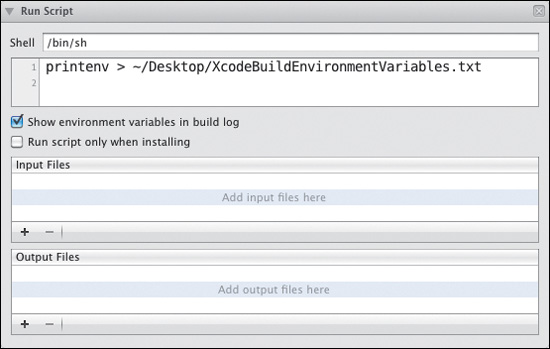
Getting At the Variables the Sane Way
Note also in Figure 19.5 the “Show environment variables in build log” check box. This is useful when debugging your scripts because the build system will dump what you just placed in a convenient text file straight into the build log.
Simple Scripting Example
A great many words could be spent detailing scripting examples both simple and elaborate. Since this book focuses on Xcode, only a basic practical example is needed to demonstrate some of the power of extending the build system with your custom processing.
In Chapter 12, you learned how to deploy an application using Xcode 4’s preferred method: the Archive action. This action builds a target for release and then creates an Xcode archive that is meant to be submitted to Apple’s App Store. As mentioned in Chapter 12, Apple seems to assume that by “deploy,” developers of course mean “sell on the App Store.” But many independent software vendors with Mac OS X products may not necessarily be ready to abandon their existing distribution channel in favor of Apple’s. Some extra effort is necessary, therefore, to customize the deployment process for these heretics.
The Scenario
Consider the following scenario. You want to distribute TestApp on your own Web site, flouting Apple’s benevolence. You’d like your users to download the application in the form of a simple zip file whose only contents is the application itself. The zip file (or some archive) is necessary because application bundles are essentially special folders, which would be cumbersome to download. Upon archiving, you want to produce this zip file and have it pop up in a Finder window so you can conveniently copy the file to a server. Of course this is a very basic solution, but this simple “gateway script” can lead you to more elaborate solutions (see the “Extending the Script” section) to suit your needs.
One way is to hook into the Archive process since it automatically builds for release and does indeed result in an archive intended for distribution. Xcode will still create its own archive (there’s currently no way to prevent it), but the custom script will create your archive as well.
Note
Of course you can hook your archive manipulation script into the Archive action’s post-action, but the example that follows will serve as a practical example of scripting in general.
Creating the Script
To get started, navigate to the TestApp project, select the TestApp target, and then click the Build Phases tab. Click the Add Build Phase button and choose Add Run Script from the menu. Double-click the Run Script title and name it Run Archive Script for clarity. Expand the new Run Archive Script phase and add the following script:
# Move to the built products directory
cd $BUILT_PRODUCTS_DIR
# Clean up any previous archiving folder and create a new one
rm -Rf Archive
mkdir Archive
# Compress the target into a zip file in the Archive folder
zip -r Archive/$TARGETNAME.zip $FULL_PRODUCT_NAME
# Show the Archive folder in the Finder
open ./Archive
Figure 19.6 shows the completed script in the Run Archive Script build phase. If you’re familiar with shell scripting, the script should be easy enough to follow. It uses environment variables that Xcode provides for easy access to the built products directory, the target name, and the full product name.
Figure 19.6 The completed custom archiving script
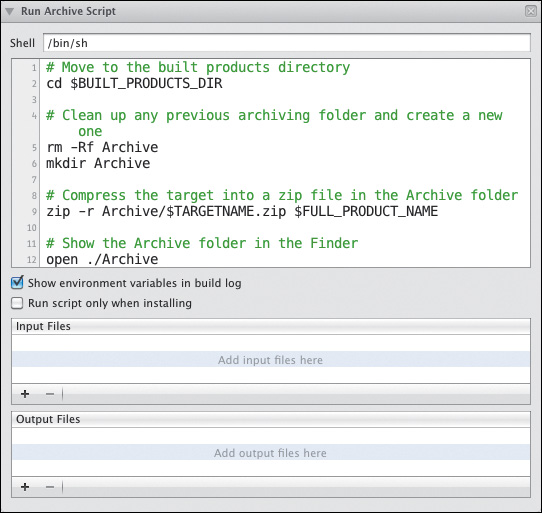
Line 2 changes the working directory to the built products directory. Lines 5 and 6 make sure there’s a clean Archive folder into which to place the completed archive (this avoids clutter when looking for the archive in the Finder window). Line 9 calls the zip command-line program to create a zip file named after the target (TestApp), using the full product name (TestApp.app) and placing the file into the Archive subfolder created on line 6. Finally, line 12 uses the open command-line program to open the Archive folder in a Finder window, neatly presenting your new archive.
To test it, run the Archive action by choosing Product > Archive from the main menu. The Archive action runs as usual, but you should also see the Finder window appear.
Tip
You may prefer to prevent Xcode from opening the Organizer (enabled by default). To do so, edit the scheme and select the Archive action. Deselect the Reveal Archive in Organizer option and click OK.
Triggering the Script on Release Builds Only
You’re not quite finished yet. Currently the script will run every time the target is built. Run the application (which builds for debugging). The archiving script also runs and pops up in a Finder window when the application is running. This is less than ideal. Since the stated goal was to run this script only when archiving (synonymous with “building for release”), a little more customization is necessary.
Why not use an Archive action post-action script? (See the “Pre- and Post-Action Scripts” section.) Xcode’s environment variables (such as BUILT_PRODUCTS_DIR, TARGETNAME, and FULL_PRODUCT_NAME) are unavailable in pre- and post-action scripts in the current version of Xcode 4. Until that changes, it’s easiest (in terms of there being far fewer and far-more-flexible lines of script) to use a Run Script build phase.
The on-archive-only problem is easy to solve using just one more environment variable: CONFIGURATION. You can use an if conditional to check if the script is run under the Release configuration. Replace the existing script with the following:
# Only under Release configuration ...
if [ $CONFIGURATION = Release ]; then
# Move to the built products directory
cd $BUILT_PRODUCTS_DIR
# Clean up any previous archiving folder and create a new one
rm -Rf Archive
mkdir Archive
# Compress the target into a zip file in the Archive folder
zip -r Archive/$TARGETNAME.zip $FULL_PRODUCT_NAME
# Show the Archive folder in the Finder
open ./Archive
fi
Figure 19.7 shows the new script. The if condition on line 2 evaluates the CONFIGURATION variable to check for the Release configuration. Line 17 ends the conditional block (fi is if spelled backward).
Figure 19.7 The amended archiving script
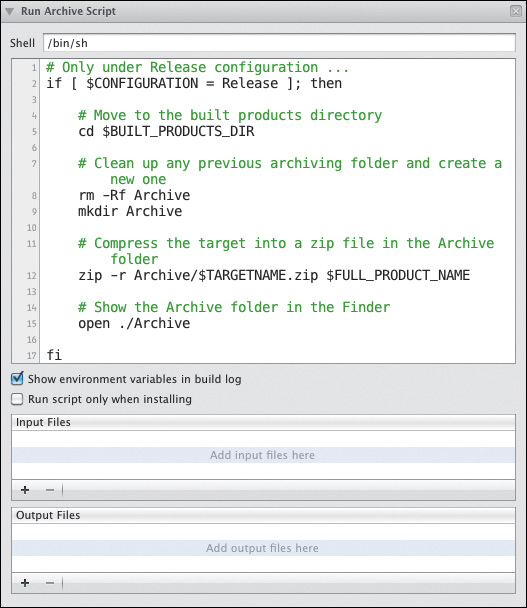
Test the script. Run the application normally—the script should not run. Now call the Archive action. This time the script runs and the Finder reveals your archive.
Extending the Script
As mentioned, this simple script shows how easy it is to customize the build process. When pre- and post-action scripts eventually provide environment variables—and they’re almost certain to in future releases—the scripts can be even more specific and less “conditional.”
The Web reveals a number of creative deployment scripts cobbled together and shared by Xcode users. Some involve uploading to a build server for testing in continuous integration environments. Some involve checking things into and out of repositories and even setting build numbers to revision numbers pulled from those repositories. Some scripts use release notes to generate update entries for “appcast” feeds, such as those used by Andy Matuschak’s venerable Sparkle automatic update framework. Others upload the archive (and associated appcast, release notes, and so on) to a staging area for testing prior to deployment on their public Web server.
With some scripting knowledge and a list of available command-line programs and Xcode environment variables, you can build quite a complex process. If you’re new to a Unix-based platform (of which Mac OS X is one), you owe it to yourself as a professional developer to explore the possibilities shell scripting offers and to leverage the rich tools the OS offers to automate your deployment tasks.
Using the Preprocessor
In Chapter 13, you saw how you can use the C preprocessor (cpp) to create separators that show up in the Jump Bar and aid code navigation. If you’re unfamiliar with the preprocessor, it may surprise you to know that it’s far more powerful than that. It has a lot more to offer than the simple pragma mark directive.
Tip
To learn more about what the C preprocessor can do for you, visit http://xcodebook.com/cpp.
Macros
One of the simplest ways to use the preprocessor is to define macros. Since the preprocessor does as its name suggests—processes the text prior to compilation—macros are automatically expanded for the compiler. This means you can use the #define command to create a kind of “lazy man’s constant” or to compress a set of nested method calls down to a simple stand-in symbol.
Where to Put Them
It’s usually preferable to define macros in a header file so they can be imported elsewhere without needing to repeat them. Many developers use a global header file for this. The default .pch file found under your project’s Supporting Files group is included everywhere and is a great place to keep global macros.
Defining a Macro
A macro is defined using the #define directive and a macro name (such as PlaceholderString or TRUNCATED_PI), followed by the expanded text for the macro. For example, the following defines a macro:
#define TRUNCATED_PI 3.14
Any time the preprocessor encounters TRUNCATED_PI in source files, the value will be “expanded to” (or replaced by) 3.14.
In Cocoa applications, it’s commonplace to use uniform type identifiers (such as com.mycompany.TestApp.testappdocument) to identify data types such as documents, pasteboard drag types, and more. As with constants, the benefit of using a macro is to cut down on the number of opportunities you might mis-type a string constant (which the compiler cannot verify for you). Since a macro, like a symbol, must be typed properly (and participates in code completion), Xcode will help you spell it correctly and the compiler will flag it as an error if you miss. A simple string macro can be defined like this:
#define TestAppDocType @"com.mycompany.TestApp.testappdocument"
This will define the macro TestAppDocType, which will be expanded to @"com.mycompany.TestApp.testappdocument" anywhere it’s used.
Another handy use for macros is to shorten long, deeply nested method calls. Many non-document-based Cocoa applications “hang” top-level controllers from the application delegate to provide an easy means of reaching them from anywhere else in the application’s code. A call to such a controller might look like this:
[[[NSApp delegate] importantController] doSomethingImportant];
You can shorten the call by defining a macro for the controller:
#define ImportantController [[NSApp delegate] importantController]
The shortened call is now:
[ImportantController doSomethingImportant];
Macros can be used as functions as well. In fact, many common (but verbose) evaluations have macros predefined in the Foundation.framework (under NSObjCRuntime.h). For example, finding the larger of two values can be evaluated as follows:
int largest = (a > b) ? a : b;
The MAX macro, however, simplifies this (for any type, not just int) as:
int largest = MAX(a, b);
Tip
An easy way to find system-defined symbols and macros is to type them into the Source Editor and then Command-click them. The editor will navigate to the definition. Try it by typing MAX and Command-clicking the word.
Poison
Although not quite as severe as it sounds, the GCC poison pragma directive can turn the use of any symbol or macro into a hard error. This is useful when trying to avoid using a particular function, variable, or predefined macro. For example, if you wanted to make sure all logging calls are made to Cocoa’s NSLog() rather than to printf(), you could “poison” printf(). This would cause the compiler to flag all existing calls and ensure any future slip-ups are avoided, should you forget and try to use printf() again later. To poison a symbol, use the following (substituting the desired symbol for printf in the example below):
#pragma GCC poison printf
Now printf() is considered poison. The antidote is to simply delete or comment out the pragma directive you just set:
// #pragma GCC poison printf
Conditionals
The preprocessor has another handy trick up its sleeve. You can use conditionals to include (or exclude) blocks of text between #ifdef and #endif or to issue errors and warnings that are dependent on the environment. The supported conditionals are #if, #ifdef, #ifndef, #else, #elif, and #endif. The #ifdef and #ifndef (“if defined” and “if not defined,” respectively) conditionals are the most commonly used.
You might use conditionals to exclude blocks of code at build time depending on some set of criteria. For example, you might include a message dialog box that appears when an application is launched and that warns the user they’re running a beta version. A simple “beta” flag can be defined in the configuration used by a “beta build” scheme, while the normal scheme does not define it. Depending on which scheme is used, the beta warning code block may or may not be included at compile time.
You can write a conditional block of code as follows:
#ifdef SOMEMACRO
NSLog(@"This code will only be included if SOMEMACRO is defined... ");
#endif
The NSLog() statement will not be included in the compiled code unless SOMEMACRO is defined. The #ifdef directive doesn’t care what SOMEMACRO represents, only that it is defined. Recall that you can define SOMEMACRO like this:
#define SOMEMACRO 1
Defining Macros in the Build Environment
Defining a macro and then checking if it’s defined is easy enough. Whether a macro is defined can also be based on the current build settings, as the BETABUILD flag is.
To try this scenario out for yourself, start by adding the following code to the end of the TestApp delegate class’s -applicationDidFinishLaunching: method:
#ifdef BETABUILD
[[NSAlert alertWithMessageText:@”Beta Version”
defaultButton:@”Ok”
alternateButton:nil
otherButton:nil
informativeTextWithFormat:@”Warning: you are using a beta version of this application. Bad stuff might happen.”] runModal];
#endif
Figure 19.8 shows the completed -applicationDidFinishLaunching: method. The NSAlert code block is wrapped in #ifdef and #endif preprocessor directives and will only be included if a macro called BETABUILD is defined.
Figure 19.8 The completed -applicationDidFinishLaunching: method
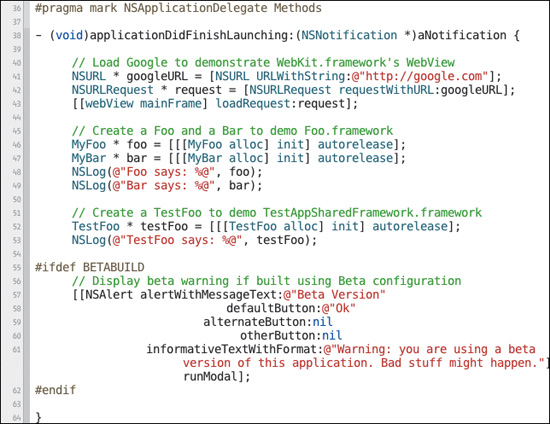
Next, you’ll need to define the BETABUILD macro somewhere, and you’ll need to let the build environment take care of defining it. This is done by adding a separate build configuration for the beta build, defining the macro in the target’s build settings (specifically, the Preprocessor Macros setting), and then creating a separate scheme that uses the beta build configuration.
To do this, you’ll start by creating a “beta” configuration. Navigate to the TestApp project, and select the TestApp target in the Targets list. Click the Info tab if it’s not already selected (Figure 19.9).
Figure 19.9 The Info tab for the TestApp target
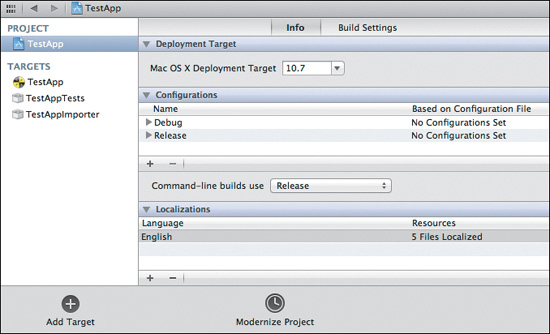
The beta configuration should be based on the Release configuration because you intend to present beta warnings in released copies of the application. In the Configurations section, select the Release configuration. Using the Add (+) button just beneath the list, choose Duplicate “Release” Configuration from the menu (Figure 19.10). Change the name from “Release copy” to Beta Release and press Return.
Figure 19.10 Duplicating the Release configuration
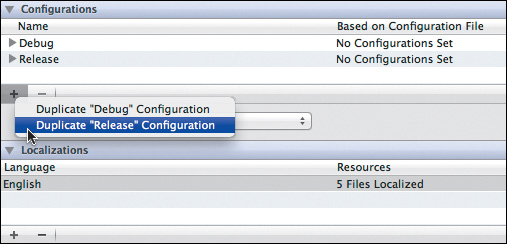
To use the separate configuration, you’ll need a separate scheme. Click the Schemes pop-up and choose Manage Schemes from the menu. In the scheme manager sheet (Figure 19.11), select the TestApp scheme and then click the Add (+) button and choose Duplicate from the menu. In the Scheme Editor sheet that appears, set the scheme’s name to TestApp (Beta) and then select the Archive action. Choose Beta Release from the Build Configuration pop-up (Figure 19.12) and click OK. There are now two schemes that build TestApp, but the beta scheme (when built for archiving) will use the Beta Release configuration you created.
Figure 19.11 Managing the schemes
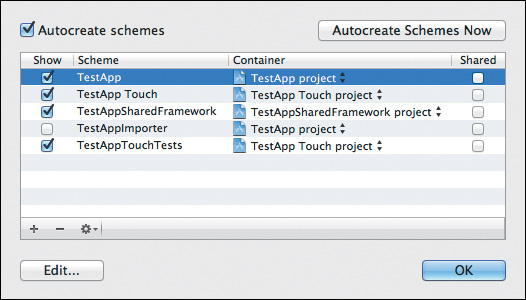
Figure 19.12 Editing the Beta Release scheme’s Archive configuration
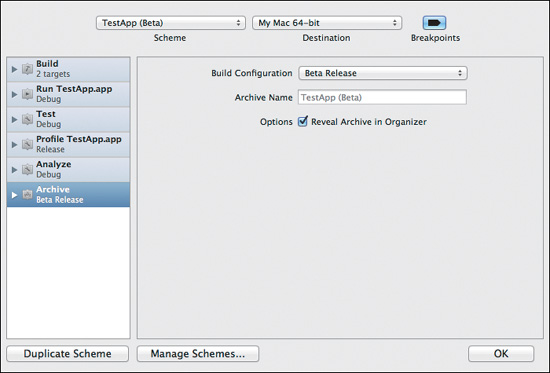
The final step is to define BETABUILD in the TestApp target’s build settings for the Beta Release configuration. Navigate to the TestApp project, then select the TestApp target and click the Build Settings tab. Search the settings for the Preprocessor Macros setting. Expand the setting so you can see the three configurations (Debug, Release, and Beta Release), as seen in Figure 19.13.
Figure 19.13 Adding a preprocessor macro
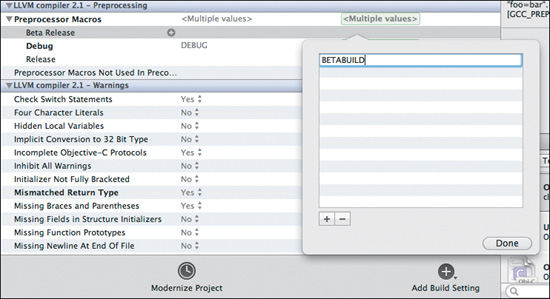
Double-click the value column (for the TestApp values) in the Beta Release row and add the macro name BETABUILD. Figure 19.14 shows the properly configured setting.
Figure 19.14 The final BETABUILD macro settings
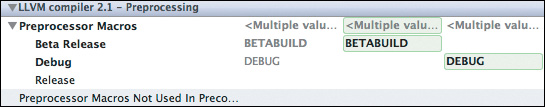
Now you can test it.
Make sure the original TestApp scheme is selected. From the main menu, choose Product > Build For > Build For Archiving and wait for the build to finish. In the Project navigator, expand the TestApp project’s Products group. Right-click the TestApp.app product and choose Show in Finder from the menu. You should see your normal-release built TestApp application in its Release folder. Double-click it to launch it, and note the lack of a beta warning. Quit TestApp.
Now select the TestApp (Beta) scheme. From the main menu, choose Product > Build For > Build For Archiving and wait for the build to finish. Again, in the Project navigator right-click the TestApp.app product in the Products group and choose Show in Finder from the menu. You should see the beta-release built app in its Beta Release folder. Launch it and be warned—it’s a beta (Figure 19.15).
Figure 19.15 The beta warning
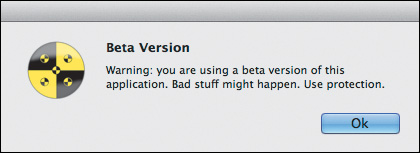
Tip
You might also use the Beta Release configuration to avoid stripping debug symbols. For this configuration, you might disable the Strip Debug Symbols During Copy setting, which will make it easier to debug the problems found by your beta testers.
Limitations
It’s important to understand the distinction between compile or build time and runtime. The C preprocessor processes source files prior to compilation. All effects on the source code happen when the code is built, not when it is run. You cannot, for example, use a preprocessor conditional to run one block of code if the application is running on Mac OS X 10.6 and another block of code if running on Mac OS X 10.5.
Tip
This is a good time to recall two things you read about in Chapter 17: the Generate Preprocessed File command and the Assistant editor’s Generated Output behaviors.
Wrapping Up
You’ve seen how Xcode’s scripting hooks can be used to extend and automate various tasks. You’ve also explored the C preprocessor’s ability to provide macros with text replacement and conditionally include text in source. Armed with a basic knowledge of these two tools, Xcode can be extended and integrated into a much larger workflow, automating tasks and making them less prone to human error. In the next chapter, you’ll learn how to profile your code, and more, with Xcode’s companion application Instruments.
20. Using Instruments
Instruments is Apple’s front end (and a few more things as well) to DTrace, a dynamic tracing system that records debugging and performance information about a running program. If you’ve never used it before, Instruments will revolutionize the way you profile and debug your applications. Once you’ve let it spoil you, you’ll wonder how you ever managed to make it out of the dark ages of leaks, zombies, and performance sinks.
An Overview of DTrace
DTrace lets you trace your application as it runs. Tracing is logging information about a running computer program for debugging and performance analysis; it is used mainly by developers. Contrast this with “high-level logging,” which is used by end users and system administrators to log program errors, exceptions, failed scripts, and so on.
Apple added DTrace support and debuted Instruments in Mac OS X 10.5. Instruments reduces the DTrace learning curve to manageable levels and makes a lot of traditionally difficult debugging tasks seem almost trivial by comparison.
In DTrace, a probe is a script to perform a specific task. In the glossy, graphic realm of Instruments, a probe (or collection of interrelated probes) is more generally referred to as an instrument. A probe is essentially a script that watches for specific events and records relevant information.
In the field of quantum mechanics, it’s been shown that the act of observing something changes its nature. This is true of profiling software as well. For example, adding a bunch of code to an application to track its performance will affect its performance. One of the most celebrated aspects of DTrace is its extremely minimal performance impact when a probe is enabled; and there is no impact for disabled probes. This means that for most developers, the act of tracing won’t have a noticeable impact on the application’s performance profile. Because of this, DTrace can be used on production systems without slowing them down.
Tip
You can run DTrace from the command line by using the dtrace command. Type man dtrace in the Terminal and press Return to learn more.
A Tour of Instruments
An entire book could (and should) be dedicated to DTrace and Instruments. The long list of available instruments continues to grow, and many require a solid grasp of one or more debugging and profiling techniques. This section will use as examples the three most common tasks for which the typical developer would use Instruments. First, however, you’ll need to get familiar with Instruments’ user interface.
An Overview of the Instruments User Interface
When you first launch Instruments, you’re given an empty document and prompted to choose a template for the trace document that Instruments will create for you. A template is one or more instruments configured in a particular way. Figure 20.1 shows the template chooser sheet with a number of templates. This sheet, like Xcode’s template chooser sheet, is broken down into categories: iOS, iOS Simulator, Mac OS X, and User (templates you’ve created and supplied).
Figure 20.1 The template chooser sheet
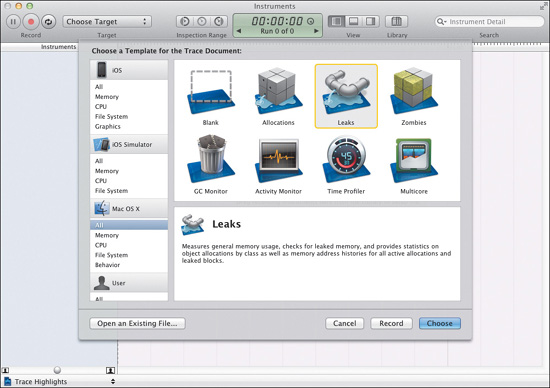
Tip
The trace operations you perform are done inside an Instruments trace document. A document contains the instruments and their configuration as well as every trace session recorded into it. It can be saved for later review, and future trace sessions can be appended to it.
Figure 20.2 shows a trace document with one 33-second trace session recorded in it. This document used the Time Profiler template found under the Mac OS X category of the template chooser. A great deal of information is shown here, with all of Instrument’s main views active.
Figure 20.2 An Instruments trace document
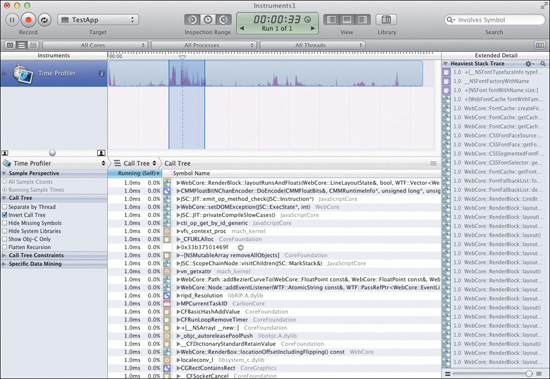
Tip
The trace document can be saved and re-opened later. You can also append a new session by using the Record button.
Figure 20.3 shows the expanded Time Profiler (using the disclosure triangle to the left of its name). The most recent track is always placed on top. Subsequent sessions will produce additional tracks for each instrument, and they can be reviewed and compared by expanding the disclosure triangle and clicking the track itself. The active track is shaded a darker blue (Figure 20.4).
Figure 20.3 The Time Profiler showing multiple tracks
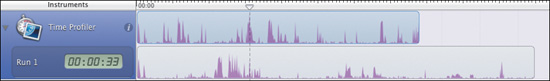
Figure 20.4 Choosing another track
There are many more view modes that won’t be covered in this chapter. Instead, let’s stick to the main views.
The Toolbar
There are some important clusters of controls on the toolbar you’ll need to understand. Let’s explore each major grouping, starting on the left side of the toolbar.
The Record and Target controls work closely together. Use the Target control to attach Instruments to any running process. Depending on how you launched Instruments (see the “Launching Instruments” section, later in this chapter), a target (the application you’re tracing) may already be selected. Use the Record controls to control the trace. From left to right, there is a pause button to pause and resume tracing the running program; the Record button to start and stop recording new tracks; and a restart button, which stops the current trace and starts a new one (producing a new track). If the program is not running when the Record button is pressed, it will be launched. If the program was launched by the trace session, pressing the Record button while recording will stop recording and terminate the program.

The Inspection Range controls specify the range of time in the track’s timeline you want to inspect. Specifically, you can filter out all trace information that is not within the specified range. The left button marks the beginning of the time you want to inspect; the right button marks the end. Setting a beginning point with no end means start here and show me everything to the end; setting an end point with no beginning means show me everything from the beginning up to this point. The middle button clears the selected range.

Though not part of the toolbar, it’s important to understand how to specify a point in time. You do this by dragging the scrubber control to the desired location in the timeline. The scrubber control is located in the graduated bar just above the instrument tracks. The term scrubber comes from audio/video applications, where the time-pointer control is moved or scrubbed across a track to view and listen to the scrubbed region of time.

The status control in the center of the toolbar shows (in hours, minutes, and seconds) the length of the current trace session (by default) or the currently displayed trace session and number of sessions in the document (if there’s more than one recorded) and provides controls (the left and right arrows) to switch between sessions. Click the small icon to the right of the time display to toggle between running time (the session’s length) and inspection time (the current position of the scrubber control).

The View controls toggle the three primary views in a trace document’s interface. From left to right, the buttons toggle the Instruments, Detail, and Extended Detail views. You’ll explore them in a moment.

The Library control toggles the Library panel (Figure 20.5), which provides all available instruments. To add a new instrument to the trace, drag it from the Library panel and drop it into the Instruments list.
Figure 20.5 The Library panel


The Search control filters the displayed trace information by symbol or library (to choose the filter, click the magnifying glass icon in the control’s left edge and select from the menu). For example, typing “drawRect” into the field will show only the trace information about the -drawRect: method provided by NSView (and any other methods containing “drawRect” in their names), assuming it’s been called during the recorded trace session.

The Strategy bar
The Strategy bar (Figure 20.6) is new in Instruments 4. It gives you three main tracing strategies to choose from. The buttons on the left edge of the bar toggle between the (from left to right) CPU, Instruments, and Threads strategies. (All the figures in this chapter thus far have shown the Instruments strategy—the default strategy in Instruments 4.) The pop-up menus let you filter by core, process, and thread. An additional pop-up appears in CPU and Threads strategies, letting you specify additional chart options.
Figure 20.6 The Strategy bar

The right-most button pops up a graphical legend (Figure 20.7) whose contents depend upon the chart mode (which colorizes the chart information). The legend shows each color used and what it represents in the chart.
Figure 20.7 The Status bar legend
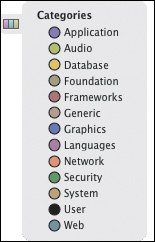
Figure 20.8 shows the trace session from Figure 20.3 using the CPU strategy. The application’s activity is divided according to the CPU core on which that activity took place. If you have more than one instrument in the Instruments list, use the pop-up below the Instruments list to switch between them and see their collected trace information (Figure 20.9).
Figure 20.8 The CPU strategy
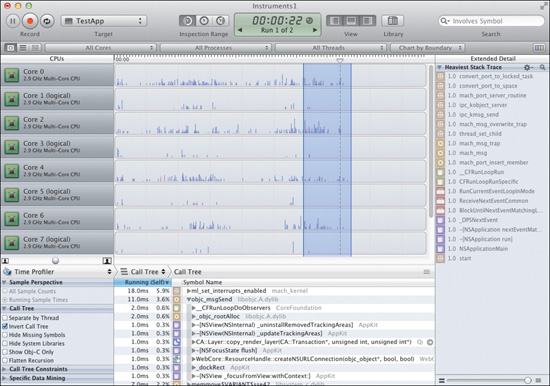
Figure 20.9 The instrument chooser pop-up
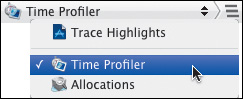
Figure 20.10 again shows the same trace session, this time using the Threads strategy. Here, the application’s activity is divided by thread (if you’re running Mac OS X 10.6 or later, you may see many threads here that you never knew were created).
Figure 20.10 The Threads strategy
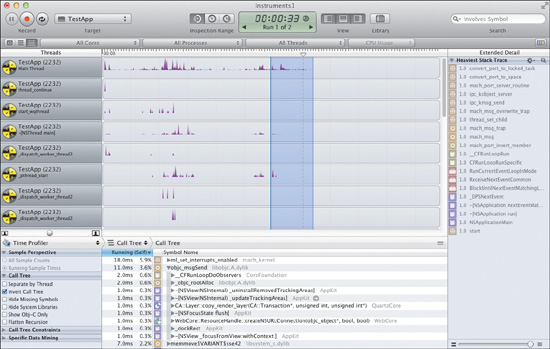
The Instruments view
The Instruments view (Figure 20.11) shows a list of all instruments (or cores or threads, depending on the selected strategy) in the top list. Each instrument can be selected by clicking it in the list. Once selected, pressing the Delete key will remove the instrument (and its data for all recorded sessions) from the trace document. Click the info button (i) to the right of each instrument to reveal a popover (Figure 20.12) that offers more trace recording data and track display options.
Figure 20.11 The Instruments view
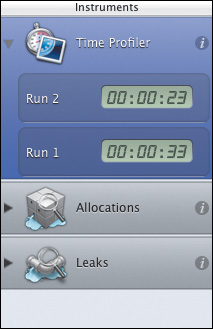
Figure 20.12 The instrument info popover
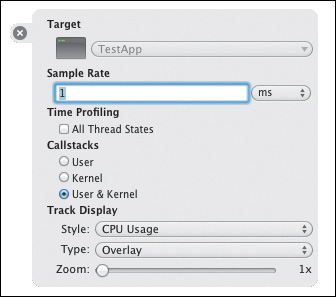
Note
The control immediately below the list of instruments zooms in and out of the timeline. It is not actually part of the Instruments view and remains where it is when the view is toggled. Similarly, the instrument chooser pop-up seen in Figure 20.9 belongs to the navigation bar of the Detail view.
The Detail view
Whereas the Instruments view (and the tracks it records) control and display the basics of what is collected, the Detail view is where the actual trace information is shown and explored. As you toggle the Detail view, notice how the navigation bar at its top always remains visible. This lets you continue navigating the data (if only for the sake of the Extended Detail view) without the Detail view being shown.
The navigation bar (Figure 20.13) is composed of three separate areas. The left-most area is the instrument chooser pop-up control (which you saw in Figure 20.9). This control lets you choose which instrument’s trace information is shown in the Detail and Extended Detail views and has the same effect as clicking an instrument in the list. To the right of the instrument chooser, the display mode lets you choose how the trace information is displayed. The list of available modes depends on the selected instrument, but most have the Call Tree and Console modes in common. Finally, the rest of the bar is dedicated to navigational context (much like the Jump Bar above Xcode’s editors), letting you navigate into and out of levels of detail in the current view.
Figure 20.13 The Detail view navigation bar

Beneath the instrument chooser control are categorical lists of filters and display options specific to the active instrument (Figure 20.14). These controls are visible only when both the Detail and Instruments views are shown, and their content can vary widely from instrument to instrument. A common use case is to run a time profile of your application, choose the Call Tree display mode, and then (under the Call Tree group in the filter and options list) choose to hide missing and system symbols and show only Objective-C information. This gives you a view of only your own code, as opposed to including information about the myriad system libraries against which your code links.
Figure 20.14 The active instrument’s options list
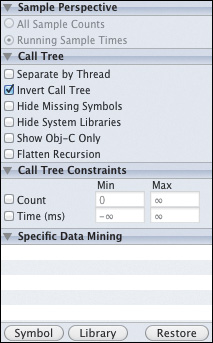
The main view (usually a table or outline) lists the individual data points that Instruments gathered about your application; the information it shows is specific to the selected instrument. Figure 20.15 shows the Objective-C–related call tree information collected by the Time Profiler. The top result reveals the method in which TestApp spent most of its time during the profiling session: the -drawRect:contentsOnly: method of the WebFrame class, which is part of the WebKit framework. This makes sense because I used TestApp’s Web window to navigate around a few Web pages for the duration of the trace. As a result, WebKit was busy drawing Web pages. You’ll explore the Time Profiler in more depth later in this chapter. Double-clicking entries in the list can often drill down into further detail. Again, this is instrument specific, so a general description is not possible here.
Figure 20.15 The Detail view showing call tree information
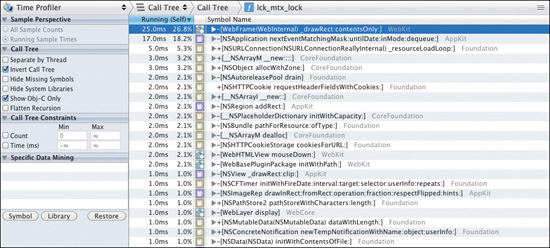
The Extended Detail view
The Extended Detail view (Figure 20.16) shows extended information about the selected data in the Detail view. As with the rest of the detail-oriented views, its content is instrument specific. In the figure, the view is displaying extended detail about the selected Time Profiler symbol in Figure 20.15. In this case, it’s appropriate to show the heaviest stack trace (the stack trace responsible for the bulk of the calls to the selected symbol). This view represents the same information as found in the Debug navigator. The slider on the bottom works in the same way as the slider in the Debug navigator as well—it smartly filters out “uninteresting” chunks of the stack trace, depending on its position.
Figure 20.16 The Extended Detail view
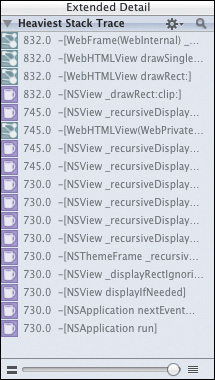
Launching Instruments
Now that you’re familiar with the main aspects of the Instruments interface, you’re ready to launch it for yourself. There are two ways to do this. You’ll learn the long way first to get a feel for how Instruments attaches to a process, and then you’ll learn the easy way.
The Long Way
The long way involves launching Instruments yourself from the /Developer/Applications folder. You’ll then choose a template for your document and click Choose. The document is configured and awaits your command. The next step is to choose the process to which you want Instruments to attach. Use the Target control and navigate its menu (Figure 20.17) to find and select the running process of your choice. The final step is to begin the trace by pressing the Record button.
Figure 20.17 The Target control’s menu
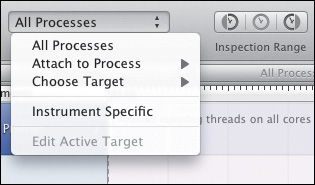
The long way is the only way to attach to processes that are already running or that are running outside Xcode. The most interesting part of that sentence is the implication that you can in fact attach to other processes for a variety of diagnostic reasons. As a power user or system administrator, for example, you can even monitor a process’s file system access—handy for snooping on an installer’s payload as it’s delivered.
The Easy Way
The easy way (for your Xcode projects) is to choose the Profile action from within Xcode. You’re already familiar with the Run, Test, and Archive actions. You can trigger the Profile action by choosing Product > Profile from the main menu; or by clicking and holding the Run button and then choosing Profile from its menu; or by pressing Command+I. Of course, you must have a project or workspace open and it must build successfully (just as when performing the Run action).
Assuming your project builds successfully, Instruments will launch and prompt you for a template for your new trace document, just as you saw in Figure 20.1. Once you choose your template, Instruments will launch your application, attach to it, and begin recording the trace. You’ll see this in action in the examples in the next section.
Using Instruments for Common Tasks
Now that you know the Instruments basics, it’s time to apply them to common debugging and profiling tasks. You’ll start by using the Time Profiler to track down a contrived performance problem. You’ll then find a memory leak and track down and kill a zombie invasion.
Time Profiling
You don’t get very far in a moderate-to-complex application without encountering performance problems. Such problems have traditionally been difficult to track down. More often than not, the cause is entirely different from what you suspected. Instruments’ Time Profiler template has an uncanny ability to show you inefficiencies in your code you may not even have suspected.
To begin, open TestApp’s TestAppAppDelegate.m file and change the -applicationDidFinishLaunching: method so that it includes this line:
[self doSomethingStupid];
After the closing curly brace of the -applicationDidFinishLaunching: method, add this new method:
- (void)doSomethingStupid
{
NSMutableArray * array = [NSMutableArray arrayWithCapacity:1000000];
NSNumber * number;
for (NSInteger i = 0; i < 10000; i++)
{
number = [NSNumber numberWithInteger:i];
[array addObject:number];
}
}
To silence the warning that appears, declare -doSomethingStupid in the app delegate’s header (TestAppAppDelegate.h) by adding the following code before the @end directive:
- (void)doSomethingStupid;
Taken together, this code creates a mutable array with a capacity of 1,000,000 objects and fills it with 10,000 instances of NSNumber. Not surprisingly, this will take a bit of time and cause the app’s UI to be unresponsive for a short time after launch. Once you have this code in place, press Command+I to invoke the Profile action.
Assuming there are no errors, Instruments will launch and prompt you for a template. Choose the Time Profiler template and click the Profile button. TestApp will launch, but it’ll take just a bit longer than usual. Once it launches and shows its windows, stop the trace by pressing the Record button. Make sure the Instruments and Detail views are shown and that the Detail view mode is set to Call Tree. Then, under the Call Tree options on the left side of the Detail view, make sure that Invert Call Tree, Hide System Libraries, and Show Obj-C Only are the only options that are selected. This shows only TestApp’s symbols. You should see something similar to Figure 20.18.
Figure 20.18 TestApp’s call tree
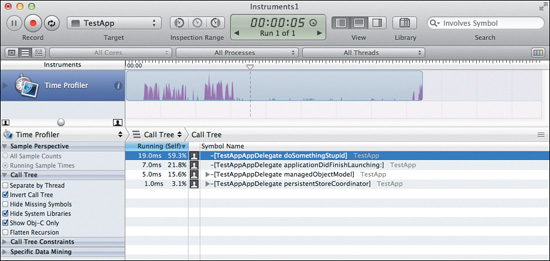
In the figure, only four symbols (all from TestAppAppDelegate.m) are shown. Though your numbers may vary slightly (especially depending on how long after launch you waited to stop the trace), it should be painfully clear that TestApp spent most of its time doing something stupid.
Many developers’ knee-jerk reaction would be to blame the tight for loop. Of course it’s going to take a while to create ten thousand objects. Astute Cocoa / Objective-C developers will know better with such a contrived example, but here’s where the Time Profiler really shines. Double-click the -[TestAppAppDelegate doSomethingStupid] symbol in the list, and the Detail view will prove its name (Figure 20.19).
Figure 20.19 Source code overlaid with a heat map
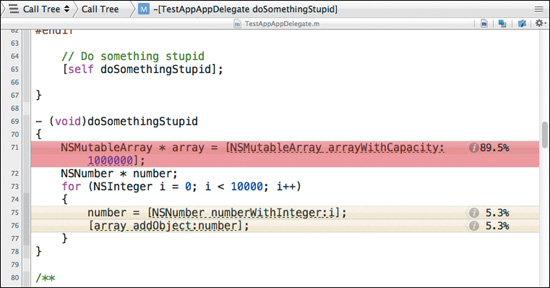
In the figure, TestAppAppDelegate.m is displayed with some additional information overlaid. Instruments has broken down the time spent in that symbol (the -doSomethingStupid method) to highlight the most time-consuming instructions within it.
To see the percentages (as in Figure 20.19), you may need to click the gear button in the upper-right corner and select View as Percentage from the menu. The overlay is color-coded to serve as a sort of heat map, where the color (ranging from “red hot” to “not-so-hot yellow” and beyond) represents how much time your computer spent executing the most time-consuming instructions.
This makes one thing very obvious: The culprit isn’t the for loop, though it certainly takes time. The red-hot instruction (89.5 percent of the method’s time in the example above) was the line where you allocated and initialized an NSMutableArray. If you don’t already know why this is, here’s where Instruments gets even better.
Click the Call Tree segment of the Detail view’s navigation bar to get back to the list of symbols. Deselect the Hide System Libraries check box to show all the system library calls in addition to those of TestApp. TestApp’s symbols should be gone, replaced by some system library symbols. Because the call tree is inverted, the deepest call in the stack is shown as top-level objects, and the top results are the calls that happened as a result of -doSomethingStupid.
Expand the items until you see something similar to Figure 20.20. You see that -doSomethingStupid goes on to call into Cocoa, and it’s spending lots of time just creating the array. While it doesn’t tell you why, it certainly draws your attention to it. The reason, for those still wondering, is that you’re abusing -[NSMutableArray arrayWithCapacity:] by allocating a ton of memory you aren’t even using. Of course it’d take just as long to allocate all that space if you were using it, but the point is that the problem wasn’t where so many developers would’ve initially suspected (especially if that allocation were done in another part of the code).
Figure 20.20 TestApp call tree with system libraries
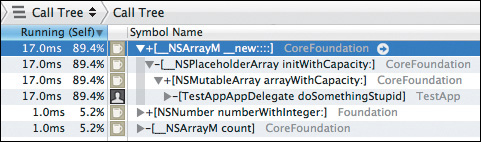
Although this was a contrived example, it neatly demonstrates Instruments’ powerfully intuitive way of visualizing trace information—a way that takes only a few clicks to reveal the source of a performance problem. Now that you know what the problem is, it might be easiest to use a saner capacity (especially since you already know you need 10,000 objects). Contrast this approach with using -[NSMutableArray array] to create the array by profiling both scenarios. You’ll see that the -arrayWithCapacity: approach is the better way to go, as long as you use it wisely.
Finding Leaks
Reference-counted memory management, as offered in Objective-C, is difficult. It’s easy to “let go” of an object before you’ve had a chance to tell it that it’s no longer needed. As you learned in Chapter 17, such an object—or, more specifically, its memory—is said to have been leaked. This is because as long as the application is still running, you no longer have a reference to the object and can’t release it (hopefully causing it to be deallocated). That memory is now stuck until your program terminates. Worse, if your leak is triggered by something that happens often, your application will quickly eat up tons of memory. On iOS and (to a lesser extent) Lion, this will result in your application receiving a low memory warning and, eventually, being terminated by the OS.
Leaks have traditionally been difficult to track down. Fortunately, Instruments makes it much simpler. To test this, let’s create and leak a single object in TestApp. You don’t need anything fancy—a simple NSObject instance will do. Add the following code to the -applicationDidFinishLaunching: method in TestAppAppDelegate.m, just after the call to -doSomethingStupid:
NSObject * leaked = [[NSObject alloc] init];
Now press Command+I to invoke the Profile action. When Instruments asks for a template, choose Leaks and click the Profile button. Since the Leaks instrument only analyzes the data every 10 seconds or so (and needs a few seconds to get started), let the trace run for 15–20 seconds before stopping it. Click the Leaks instrument to select it (the Allocations instrument is at the top of the list and is along for the ride to help out). You should see something similar to Figure 20.21.
Figure 20.21 The Leaks instrument
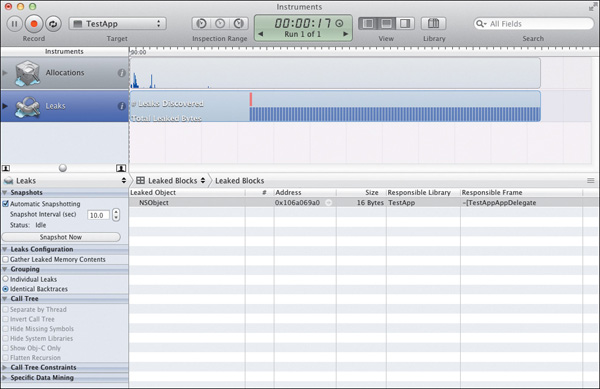
You’ll see that Leaks found exactly one leaked object. It’s an NSObject, just as expected. If you click the right-facing arrow to the right of its memory address (in the Address column), you’ll see the object’s history (Figure 20.22). It doesn’t have much of a history (a live object with a long life span might have pages worth of retains, releases, and autoreleases), but the history that’s there tells you everything you need to know. The Responsible Caller column indicates it was leaked in -applicationDidFinishLaunching:, just where you expected it to be.
Figure 20.22 The leaked object’s history
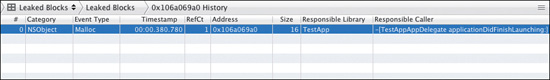
Double-click the history entry. Figure 20.23 shows exactly where in the code the object was leaked. By the time -applicationDidFinishLaunching: finishes, the reference to the object (named leaked) is no longer valid. You’ve lost any chance to tell that object that it’s no longer needed by sending it a -release or -autorelease.
Figure 20.23 The leaked object highlighted in code
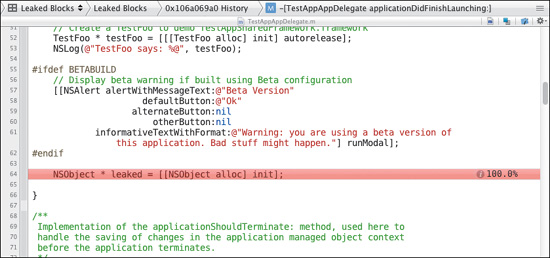
Often, you’ll need the object’s complex history to follow the lifecycle of an object that’s been created, handed around, and then mishandled rather than being properly destroyed when it’s no longer needed. Double-clicking each point in the history can not only help you identify where the object’s destruction was fumbled, but it can also provide insight on where the fumble really started (which can be well upstream of the fumble itself).
Killing Zombies (Go for the Head)
If leaks had an opposite, the dangling reference, or accidentally over-released object, would be it. A dangling reference is a pointer variable that wasn’t set to nil when its object went away (was deallocated) and that now points to an invalid memory address. It results in a crash with the telltale signal EXC_BAD_ACCESS, which is the operating system’s way of telling you you’re not supposed to be poking your nose around there anymore. These are officially many Cocoa developers’ least favorite memory management bugs.
A mechanism, NSZombie, has existed for a long time that helps developers track down these pesky bugs. When “zombies” are enabled, the runtime, rather than deallocating objects, will turn the objects into zombies and keep them around. If a zombie is messaged (indicating your code tried to reference an object it shouldn’t have), the system flags it as a messaged zombie. Zombies aren’t bad things that happen to an object; they do developers an invaluable service. Then the developer bashes in their heads with a shovel.
In the past, you’d have to pass an argument into your application manually on startup and then do a bunch of digging around to make sense of the results. You should now expect how much simpler Instruments makes it. To find out, replace the leaked object line from the previous example with these three lines (and make sure you get the spelling right—that’s brraaiinns):
NSObject * brraaiinns = [[NSObject alloc] init];
[brraaiinns release];
NSLog(@”%@”, brraaiinns);
Now profile the application (Command+I). Choose the Zombies template. Almost immediately, the application falls flat on its face with a crash. You’ll see two things. The topmost will be the unexpected-quit notification (Figure 20.24), which is safe to ignore (by pressing Ignore). More interestingly, in Figure 20.25 you’ll notice a handy popover notifying you that a zombie was messaged. Click the right-facing arrow beside the zombie’s memory address to see the memory address’s sordid history.
Figure 20.24 An unexpected-quit notification
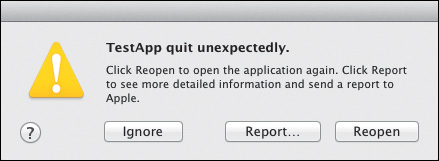
Figure 20.25 Instruments flagging a messaged zombie
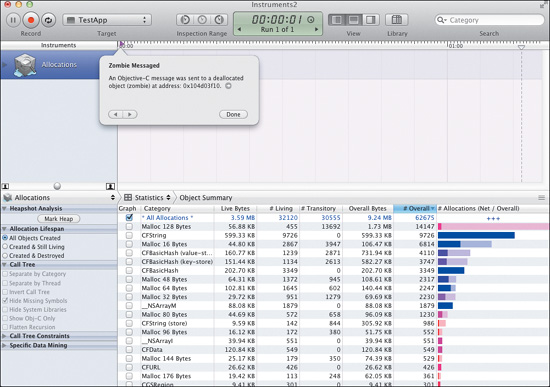
Figure 20.26 shows the complete lifecycle of the memory address in question. The telltale entry is the one that shows a –1 under the RefCt (reference count) column. A message was passed to that zombie. Double-click each entry to see the code (really any entry will do since the entire history happened within three consecutive lines of code).
Figure 20.26 The zombie object’s lifecycle
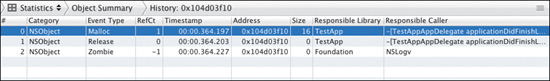
The history shown in Figure 20.26, along with enabling us to navigate to the point in the code where the object was messaged when it should have died, is invaluable for discovering the flaw in logic that led to the memory management bug. Because it is displaying the history of a memory address rather than the history of the object itself, it’s important to keep in mind that you may see entries from the lifecycles of other objects that lived at that address as well. Look for the telltale –1 reference count to make sure you’ve got the right object.
Tip
You might have noticed that the Zombies template is actually just the same old Allocations instrument. The difference is in the extra options switched on in its info popover (click the i button to the right of the instrument in the Instruments list).
Many Other Instruments
There are a number of other excellent Instruments templates and nowhere near enough space in this book to detail them. There are templates for analyzing memory management, garbage collection, multicore processes, Grand Central Dispatch queues, file system access, and Lion’s Autolayout, and there’s even a UI recorder that can record and play back user interface events for repeated UI testing. See the Instruments documentation via its Help menu for more details.
Wrapping Up
You’ve seen how Instruments provides a very simple GUI interface to a powerful tracing system. The impressive variety of debugging and testing tasks that it turns into trivial afterthoughts can be overwhelming. If after all this you’re not itching to attach Instruments to your own apps to see what kind of previously undiscovered performance and memory problems jump up and smack you in the face with stunning Apple UI beauty, you are stubborn and probably want this whole GUI fad off your lawn. In the next and final chapter, you’ll explore Apple’s GUI treatment of source code management, which may make you just as cranky.
21. Source Code Management
Source code management, also known as revision control or version control, is a form of change control that is vital to any medium-sized to large development project. In team environments, a full source code management system is often used for managing work that is done by multiple people on the same resources.
Xcode offers two primary ways to manage your source code: by using snapshots and through its integration with two full source code management (SCM) systems. You’ll explore both in this chapter.
Xcode Snapshots
The simplest way to place your code under version control is to use Xcode’s snapshots feature. A snapshot is merely an archived copy of your entire workspace. Xcode lets you restore a snapshot, which is the equivalent of extracting a copy of the workspace folder from the time of the snapshot.
It’s the most basic form of version control there is, and if you don’t use a full SCM system, you owe it to yourself to at least use snapshots. If you ever make complicated experimental changes that don’t work out, you’ll be thankful you took that snapshot before you started really messing things up. It’s so important, Xcode attempts to coerce you into enabling automatic snapshots the first time you use the Refactor features.
Configuring Snapshots
Snapshots can be configured by choosing File > Workspace Settings (or Project Settings, if you’re working with individual projects) from the main menu. The Workspace settings sheet will appear. Click the Snapshots tab to reveal the Snapshots settings (Figure 21.1).
Figure 21.1 The project’s Snapshots settings
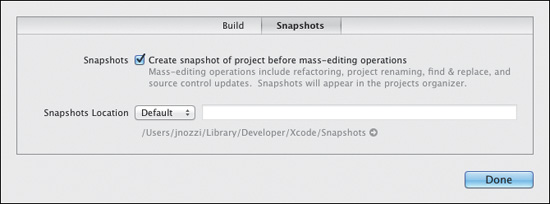
The check box controls whether snapshots are taken automatically before mass-editing operations (such as refactoring or workspace-wide find and replace). Since Xcode asks you if you want to enable automatic snapshots prior to your first use of a mass-editing feature, it’s unnecessary to enable this feature through this panel, but it can be useful if you want to disable it later in favor of a full SCM system.
The Snapshots Location control lets you store snapshots for the current workspace or project in an alternative location. The default is a location in your home folder, which lives alongside Xcode’s derived data and archive folders.
Snapshot settings belong to individual projects or workspaces. That is, any settings you change here affect only the current workspace or project.
Taking a Snapshot
You can create a snapshot of your project at any time by choosing File > Create Snapshot from the main menu (or by pressing Command+Control+S). You’ll be prompted for a name and description (Figure 21.2).
Figure 21.2 The Create Snapshot sheet
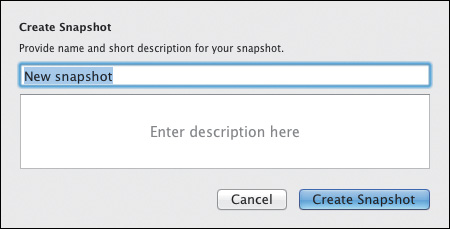
Leaving all your snapshots named “New snapshot” and without a description would be useless to you later. A good name and description should be chosen so you can identify exactly at what point the snapshot was taken if you need to find it later.
Choose whatever naming and description system works best for you, but you should definitely have a system. Figure 21.3 shows a possible name and description. Click Create Snapshot to take the snapshot. A complete copy of your workspace—exactly as it is now—will be archived and stored in the snapshots location that you specified.
Figure 21.3 A meaningful name and description
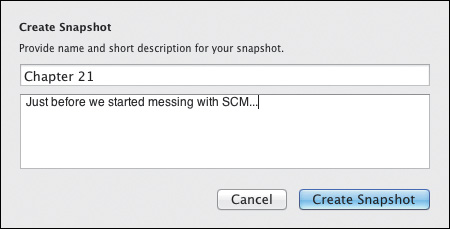
Managing Snapshots
Snapshots are managed in the Organizer window. Choose Window > Organizer from the main menu and select the Projects tab. Select the project or workspace whose snapshots you want to manage. Figure 21.4 shows the TestApp Suite workspace snapshots.
Figure 21.4 The TestApp project’s snapshots
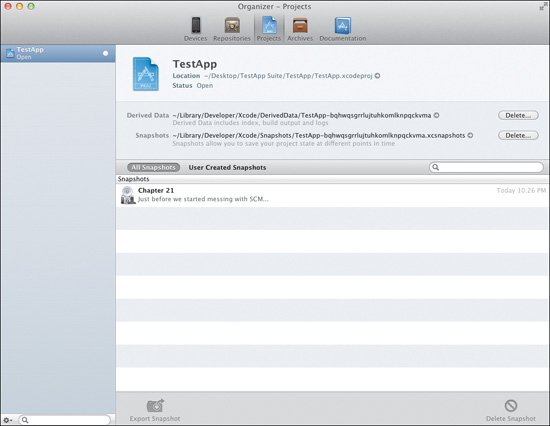
In the figure, a filter bar is positioned directly above the list of snapshots. The search bar filters by keyword (in the title as well as the description). You can also choose to show all snapshots for the workspace or only those you took yourself (that is, you can exclude automatic snapshots).
The list shows the snapshots sorted by date. Selecting a snapshot enables the Export Snapshot and Delete Snapshot buttons along the bottom edge. The Export Snapshot button will place an extracted copy of the snapshot into the location of your choosing, while the Delete Snapshot button will remove the snapshot permanently.
Restoring from a snapshot
You can restore a snapshot by choosing File > Restore Snapshot from the main menu. Select the snapshot from the list (Figure 21.5) and click Restore.
Figure 21.5 The snapshot chooser sheet
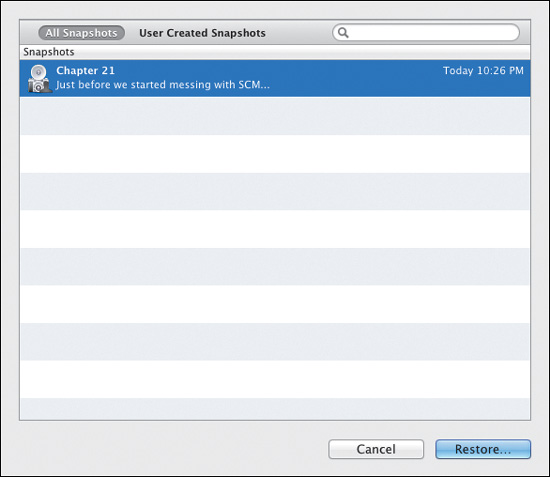
A sheet will appear (Figure 21.6). Choose the specific files you want to restore from the list on the left. To restore the entire project, just leave all the files selected. Click Restore. The project will be restored to the state it was in when you took the snapshot (or only the selected files will be, if you’ve not included all the files in the restore). As a bonus, Xcode will automatically create a snapshot just before restoring a snapshot so you can undo your undo. This will happen only if you enabled the “Create snapshot of project before mass-editing operations” feature.
Figure 21.6 The snapshot review sheet
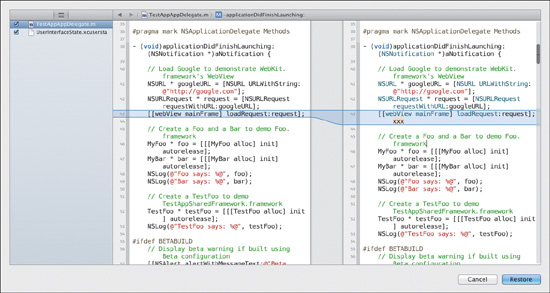
Using an SCM System
Xcode’s snapshots feature manages backup copies and can be used to store multiple versions of your project and its resources, but if you’re familiar with SCM systems—and this section of the chapter assumes that you are at least somewhat familiar—you can see how comparatively limited snapshots are.
Xcode currently supports and integrates with two well-known SCM systems: Git and Subversion (SVN). Whereas Subversion is primarily server-based (with the server usually but not always being a remote location), Git is what is known as a “distributed SCM” and does not require a server (remote or otherwise) to operate. There are many benefits to distributed SCMs, and this and other reasons make it likely that Git (or some other distributed SCM) will usurp Subversion in the coming years. Apple seems to agree. Xcode’s Git support is slightly more pervasive and noticeably more polished than its Subversion support. All that said, Xcode installs the necessary tools for both Git and Subversion support. Type man git or man svn in the terminal for details.
Note
To learn more about Git, see http://xcodebook/gitimmersion; for SVN, see http://xcodebook.com/svnprimer.
Git and SVN Differences
In most cases, the biggest differences are in the terminology. For example, where a Git user clones, a Subversion user checks out a working copy. Where a Git user pulls, a Subversion user updates (and possibly merges). Git users stage changes and commit them, then possibly push them to the remote server (the origin); Subversion users simply commit (though don’t be fooled—there’s a lot to be said for Git’s model).
The biggest difference between the two systems is that, as hinted at in the previous paragraph, a Subversion user’s commit means the change becomes part of the repository (usually on a remote server from which it was checked out), whereas a Git user’s commit is a local operation. The Git user has a copy of the entire repository (and its full history) and can choose whether or not to push those changes to the origin (usually a central repository hosted on a server). Git commits can happen whether or not the remote server (the clone’s origin) is reachable.
This chapter will focus on Xcode’s Git support only partly because Apple seems to have chosen sides. Mainly, Git gets the spotlight because Xcode provides, where possible, a homogenized user interface that works nearly the same way whether you’re using Git or Subversion. The differences, where there are any, are mild. Unless specifically mentioned, the differences are mostly those of terminology.
Managing Repositories
More than likely, you have existing Xcode projects that are tied to existing repositories. You may already have a local clone (in Git) or checked-out working copy (in Subversion). The quickest way to make Xcode aware of an SCM-attached status is to open the project. Xcode will try to set up any connections to the repository’s origin or to the Subversion remote server. If authentication is required and Xcode does not have the credentials, it will prompt you for them upon opening the project.
You can manage repositories with the Organizer window. To view them, choose Window > Organizer from the main menu, then choose the Repositories tab. The Repositories tab of the Organizer (Figure 21.7) maintains a list, on the left side of the panel, of all repositories it’s encountered (and their associated clones and origins). The repository’s details as well as its history are displayed on the right when a repository is selected; when a working copy or clone is selected, the file and folder structure, the working copy’s history, and an SCM-specific toolbar are shown. You’ll explore this UI in detail throughout the rest of the chapter.
Figure 21.7 The Repositories tab of the Organizer
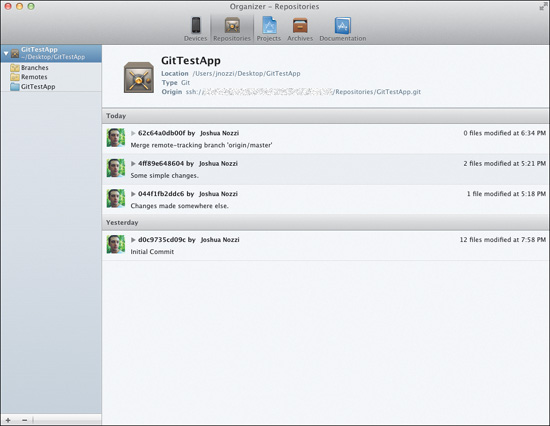
If you’ve been following along with a TestApp project of your own, then Xcode has already been tracking the Git repositories for each of the projects you’ve created (TestApp, TestAppSharedFramework, and TestApp Touch). Because you chose to let Xcode create a Git repository for each project, you have three separate repositories. Some may choose to have one repository for a suite of related applications and libraries, but with Xcode’s new workspaces concept, the borders between these repositories are barely noticeable and don’t get in the way of typical day-to-day tasks.
Creating Repositories
As you learned in previous chapters, Xcode will let you create new Git repositories when you create new projects. When you’re prompted for a location into which to save a new project, the Save dialog contains a Source Control option at the bottom. Figure 21.8 shows the Source Control option to create a Git repository selected.
Figure 21.8 Creating a Git repository when saving a new project
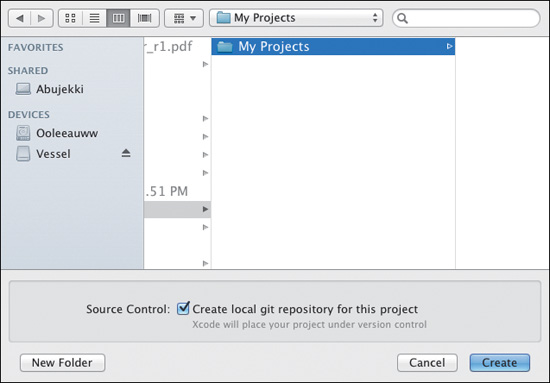
Unfortunately, this is the extent of Xcode’s repository-creating powers. That is, it’s limited to creating local Git repositories at the time a project is created. It cannot initialize a new repository for existing projects.
All is not lost. You can still take full advantage of Git by using the command line to turn an existing project into a Git repository. In the terminal, type the following (where your_project_folder is the full path to your project’s main folder):
cd your_project_folder
git init
That’s it. The folder is now the home of a Git repository, albeit one in which nothing is yet committed.
To create a locally hosted Subversion repository, you can’t use Xcode, but you can use the terminal:
svnadmin create your_project_folder
mkdir your_project_folder
You can then manually import an existing project into the new repository using the following code:
svn import path_to_existing_files file://full_path_to_project_folder/trunk/ -m "Initial import"
Not as elegant as Git, but it gets the job done.
Adding Repositories Manually
You can add repositories and working copies with the Organizer. Whether you removed them yourself or Xcode could not for some reason add them automatically when opening a project under version control, you can add and remove them manually. This is done with the Add (+) button at the bottom of the source list.
Keep in mind that the source list is an outline. The top-level nodes are individual repositories. Their children are all the known working copies or clones that belong to them, as well as convenient folders to access branches and tags.
To add a repository, click the Add (+) button and choose Add Repository from the menu. A sheet (Figure 21.9) will appear, asking you for a name, location, and type. The name is just a convenient identifier and can be anything you like (for example, My Company Repository or just Fred). The location, however, must be a valid URL to a repository.
Figure 21.9 Adding a remote Git repository
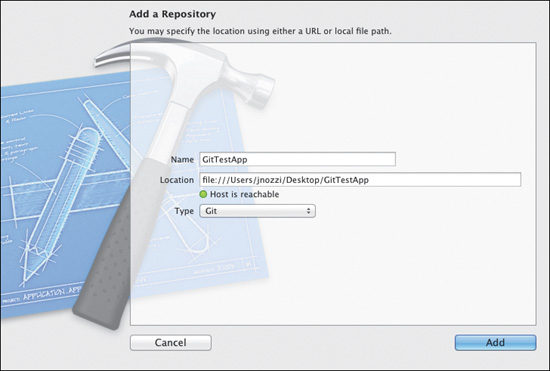
The type will be automatically detected when using URLs with schemes like svn:// and git://, but those starting with ssh://, http://, or https:// will require you to choose the correct SCM system type in the Type field. The indicator light beneath the Location field will glow green when the supplied URL points to a valid repository.
Tip
The Add a Repository sheet is probably more useful for Subversion repositories, since a cloned Git repository is a copy of the entire repository. For Git, it’s actually more user friendly to add a repository by opening the project in which it’s contained—Xcode will set up everything (including the origin, if one exists) for you.
To add a Git clone (or a Subversion working copy), you can either drag it into the source list in the Repositories tab of the Organizer or again use the Add (+) button, selecting Add Working Copy from the menu instead. This time you’ll be faced with a standard Open dialog that allows you to choose the folder containing the working copy or clone. Once you choose the folder, the working copy (and its associated repository entry) should be added to the Organizer.
Note
For Subversion repositories, the branches and tags folders must exist at the root level of the repository you added in order for Xcode to recognize them automatically. There is currently no way to “map” the corresponding entries in the Organizer list to folders that are not in this expected location.
Cloning and Checking Out
If you don’t already have a local clone, Xcode offers several ways to create one from within its UI. One way is to use the Organizer’s Add (+) button. Another way is to use the Welcome to Xcode window (Command+Shift+1) by selecting the Connect to a Repository option. Figure 21.10 shows a Git repository called GitTestApp that is hosted on a remote server via ssh. The indicator beneath the Location field shows that the host is reachable and the location is valid.
Figure 21.10 Specifying a remote repository location
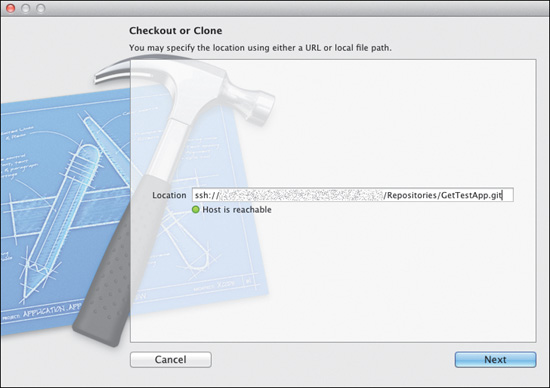
Click Next to reveal the sheet seen in Figure 21.11, which asks you to give the working copy or clone a recognizable name. Again, this can be anything you want. The Type field is usually already set to the correct SCM type (Subversion or Git), but if it’s incorrect or not specified, you’ll need to select it here. Click the Clone (or, for Subversion, Checkout) button to continue. You’ll be prompted for a location on your computer into which to save the clone or working copy. Choose a location and click Clone.
Figure 21.11 Naming the clone
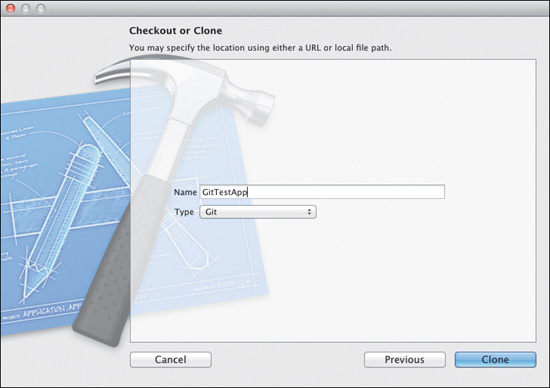
The clone or checkout will begin. You may be asked for authentication information. Supply the necessary information and click OK to proceed. Depending on the size of your repository, the actual checkout or clone may take a while. When it’s finished, it will show up in the Organizer along with the rest of your repositories.
Note
It’s common to set up an SSH key for “passwordless” authentication to an SCM server. If you have a key set up for the server already and Xcode prompts you for a username and password, it’s best to leave the username field as it is and supply no password. For a Git-themed example of setting up an SSH key, see http://xcodebook.com/gitkey.
Performing Routine SCM Tasks
You’ve seen how to clone and generally manage your Git repositories. Now you’ll explore how to perform the more typical day-to-day SCM management tasks in Xcode and manage changes to your projects.
Managing Folders in Subversion
Subversion works with files and folders; Git works with files or chunks (changed parts of files). For this reason, Subversion users need to make directory structure changes through Subversion, whereas Git users are able to freely move files and folders around.
In Xcode, you manage Subversion folders using the Repositories tab of the Organizer. You’ll need to first select the repository. To add a folder, use the list in the right-hand pane (the one showing your working copy’s directory structure) to select a folder in which you want to create the subfolder, then click the New Directory button. To delete a folder, click the Delete button in the Organizer. Rename folders by clicking them in the Organizer and editing them as you would any other filename. Each of these changes will require an immediate commit. Xcode will prompt you to enter a commit message.
Checking Status
Throughout the book, you’ve been avoiding the elephant in the room (or rather the symbols in the Project navigator). Figure 21.12 shows the TestApp Suite workspace in the Project navigator. The expanded TestApp project shows project members’ pending SCM status as “badges” along the right edge of the list.
Figure 21.12 SCM status in the Project navigator
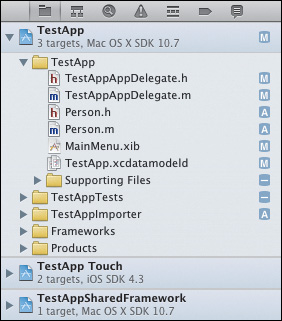
The meaning of each of the status badges is as follows:
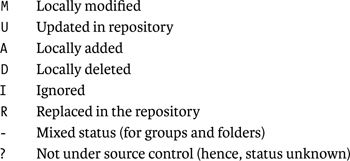
The status messages can have different meanings, depending on the SCM system you’re using. See the SCM system’s documentation for details. These generic symbols represent the least common denominator for the two SCM systems.
You can also filter the Project navigator list so that it shows only those project members that have a pending SCM status (Figure 21.13). Turn off the filter button to go back to showing all project members.
Figure 21.13 Project navigator filtered by SCM status
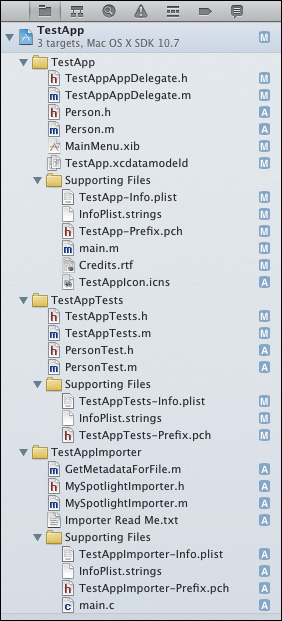
The status of individual files can be examined in slightly more detail by using the File inspector of the Utility area. The Source Control section (Figure 21.14) shows the version, status, and location of the source-controlled file.
Figure 21.14 Source control in the Utility area
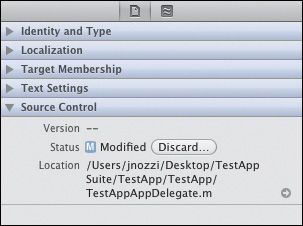
Committing and Pushing
Comitting your changes to the repository is straightforward, and there are several ways to do it. You can commit all outstanding changes or only the selected files.
Xcode stages files newly added to the project for the next commit. That’s currently the limit of Xcode’s support for Git’s powerful staging feature, where all or part of a file’s changes are staged to be part of the next commit (which would leave you the option to commit only specific changes within a file). Instead, Xcode’s commit means stage and commit with Git repositories.
To commit all outstanding changes across all projects in the workspace (or merely all changes in the project if you have only one project open), choose File > Source Control > Commit from the main menu. A sheet similar to Figure 21.15 will appear. Like the Find and Replace preview sheet you learned about in Chapter 8, this sheet displays a list of files on the left and a preview area on the right. Select any file in the list to preview the differences between the repository and the working copy of the file. To choose a file to commit, select the check box to the left of the file’s name.
Figure 21.15 The commit review sheet
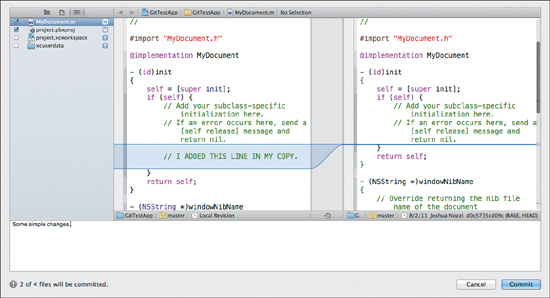
Enter your commit message in the text editor at the bottom of the sheet, and click the Commit button to commit the changes. Assuming there were no errors, the SCM status flags will then disappear, showing that there are no files with outstanding SCM status.
Note
When you use the main File menu to commit changes to projects across multiple repositories, Xcode treats this as if you’d performed individual commits for each working copy or clone using the same commit message.
If you need to commit only a handful of files, you can select them individually in the Project navigator, right-click one of the selected files, and choose Source Control > Commit Selected Files from the context menu. The same commit sheet you saw in Figure 21.15 will appear, and it works the same way. You can also commit from the Repositories tab of the Organizer by selecting a working copy or clone from the source list and pressing the Commit button on the bottom toolbar.
Pushing Changes
When using a Git repository cloned from a remote origin, you can also use the Source Control menu to push your local commits to the origin from within Xcode. Choose File > Source Control > Push from the main menu. A sheet will appear (Figure 21.16), asking you to choose the branch to which to push. Once you choose the branch, click Push. Xcode will then push the changes.
Figure 21.16 The branch selection sheet
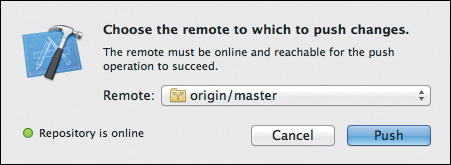
Pulling (or Updating) and Merging Changes
Pull changes into your clone by choosing File > Source Control > Pull from the main menu. A sheet similar to the branch selection sheet will appear, asking you to choose the remote from which to pull. Make your selection and click the Choose button. If there are any differences, a sheet (Figure 21.17) will appear, allowing you to review each difference. This allows you to cherry-pick the changes you want to pull into your clone.
Figure 21.17 The pull review sheet
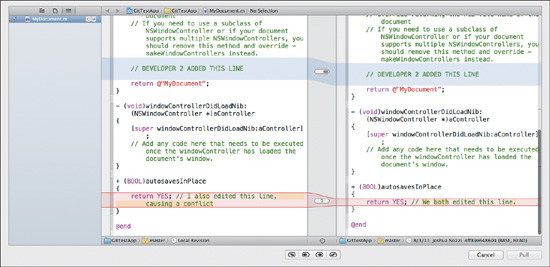
Figure 21.17 shows two changes (there are in fact three pending, but only two are visible in the figure). The first, outlined in blue, is simply a text addition. The second, outlined in red, is a conflict. That is, both the local clone and the remote version have changes on the same line. Select a highlighted difference by clicking anywhere within the highlighted area, and use the buttons on the bottom of the sheet (Figure 21.18) to control the changes.
Figure 21.18 The merge control buttons

The buttons control whose changes you want to keep. Starting from left to right, the choices are:
Left then Right—Keep your changes and insert the remote changes below them.
Left—Keep your changes and discard the remote changes.
Right—Discard your changes and accept the remote changes.
Right then Left—Keep your changes and insert the remote changes above them.
You might get away with ignoring unconflicting changes pulled in from others, but Xcode will not allow you to continue until you resolve any conflicts. Resolving the conflict can be as simple as choosing a side or as complicated as pulling in both changes and fixing the mess (and then committing and pushing that resolution) yourself.
Creating and Switching Branches
Git branches can be created in the Repositories tab of the Organizer. Select the repository’s Branches folder in the repositories list, and click the Add Branch button on the bottom toolbar. A sheet will appear (Figure 21.19), prompting you for a name for the new branch and for the “starting point” (the branch from which to create the new branch).
Figure 21.19 The “Create a branch” sheet
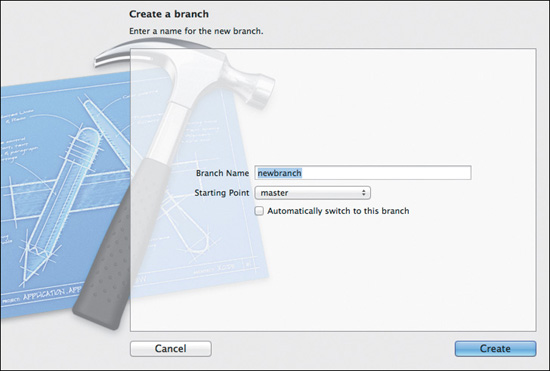
You can also select the “Automatically switch to this branch” check box to have Xcode immediately switch (or check out for Subversion) branches after creating the new one. Subversion users will additionally be asked to type a commit message. Click the Create button, and the new branch will be created and will show up in the Branches folder.
Switching branches is similarly done in the Repositories tab of the Organizer. Select the clone itself in the repositories list, then click the Switch Branch button in the bottom toolbar. A sheet (Figure 21.20) will appear, letting you choose the branch you want to switch to. Click OK to switch to the selected branch.
Figure 21.20 The switch branch sheet
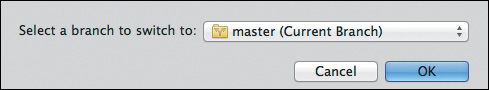

Comparing and Browsing History
It’s often necessary to browse previous versions of files in your repository or to compare versions. Xcode’s support for this is hidden in plain sight. You’re already familiar with the first two buttons in the editor mode button bar in the main toolbar. The first button is the plain editor mode. The second reveals the Assistant editor. The third and final button reveals the Version Editor (Figure 21.21).

Figure 21.21 The Version Editor
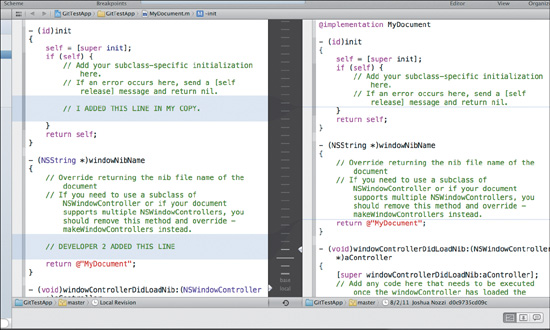
At the bottom of the channel between the two source editors, you can click the clock icon to reveal a timeline. Scrubbing the mouse over the timeline reveals past versions (Figure 21.22), much like the user interface of the Mac’s Time Machine backup feature. Click a version to display it in the right-hand editor for comparison. Differences are highlighted, as in the pull review sheet (Figure 21.17), though you have to hide the timeline to see the familiar expanding or contracting highlight.
Figure 21.22 Scrubbing the revision timeline
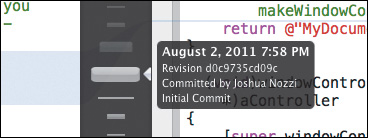
Just beneath each editor is a Jump Bar that allows you to select revisions directly from any branch in which the file exists (Figure 21.23). This lets you compare two non-current revisions.
Figure 21.23 The revisions Jump Bar
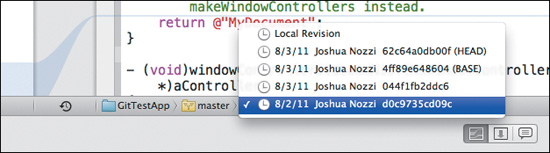
There are two other handy view modes in the Version Editor: Blame and Log. Select a view mode by using the button bar in the lower-right corner of the Version Editor (Figure 21.24).
Figure 21.24 The view mode button bar

Blame mode (Figure 21.25) shows “who is to blame” for each revised section of the file. If the entire file is from the same revision, there will be only one person to blame. If, however, different sections have been revised (changed and committed) at different times, each section might have different people to blame at different times. Each revised section is labeled along the right with the name of the person who made the change, the date they did it, their commit message, and other details.
Figure 21.25 Blame mode
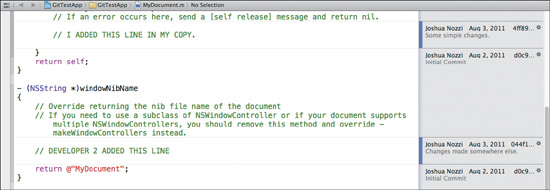
Log mode (Figure 21.26) is a flat history of revisions of the file. It’s mainly useful for seeing the history of commits involving that file. For an unfiltered view of history, use the Repositories tab of the Organizer window.
Figure 21.26 Log mode
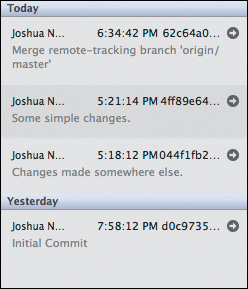
Reverting and Discarding Local Changes
Perfect people don’t make mistakes and therefore likely don’t need a source code management system. Unfortunately, none of them are employed at software companies, so the rest of us need a way of undoing our mistakes. There are two levels of severity: discarding your local changes (replacing them with the most recently committed version) and reverting to earlier committed versions.
To discard changes in a single file, navigate to it and choose File > Source Control > Discard Changes from the main menu. Confirm the decision by clicking Discard Changes when prompted. To discard changes for multiple files, select each one in the navigator and choose the same menu option. All changes in all selected files will be discarded.
Wrapping Up
You may have noticed that a few SCM topics are missing. That’s because, as of this writing, Xcode’s SCM support is still somewhat limited. In some cases, a feature may simply not have been added yet. In others, it may not be added because it’s too specific to the SCM system. Either way, for anything beyond the basics, you may still turn to your favorite GUI front end or to the command line.
If your SCM needs are basic to moderate, Xcode has you covered. At the very least, snapshots provide very basic version control so you don’t lose hours (or days) of work to a stupid but honest mistake. If you haven’t begun using version control yet, you should start now. Xcode makes it easy.
In the next chapter ... oh wait. There is no next chapter. Xcode has many more hidden gems, but let’s leave the deep-diving and spelunking to heavier and much more pedantic books.
Index
A
.a extension for libraries, 196
accessors, creating, 124
action buttons, adding, 55–56
actions
adding and removing, 301
nibs, 48
post-Build-action actions, 301
Activity Viewer, 33
Add to Targets option, for adding files, 73
adding
actions, 301
breakpoints, 24
files to projects. See files, adding to projects
repositories manually, 359–361
addresses (memory), 246–247
analysis. See debugging and analysis
App Store, submitting applications to, 139
AppKit.framework, 197
Apple
Cocoa documentation, 49
developer forums, 42
documentation errors, 42
iOS Developer Program, 260
Application Help Books, 93
application icons, customizing, 127–133
application icons, setting, 131–132
artwork, 128
document icons, setting, 133
icons, creating, 129–130
applications. See also iOS devices, debugging apps for
building and running, 17
document-based/plain applications, 13
naming, 12–13
when to use workspaces, 220
applications, deploying, 135–141
alternatives to archiving, 140
archiving, 136–139
Release mode and, 135–136
apps. See applications; iOS devices, debugging apps for
Apps controls (build systems), 193
ARCHIVE_DSYMS_PATH, 140
ARCHIVE_PATH, 140
ARCHIVE_PRODUCTS_PATH, 140
archiving, 136–140
alternative to, 140
applications, sharing, 139
applications, submitting to App Store, 139
applications, testing, 139
Archive action (schemes), 189
archives, creating, 136
archives, examining, 138
archives, finding, 137
scripting example for (amended), 310–311
scripting example for (simple), 307–309
Arguments tab
Profile action, 188
Run action, 185
Test action, 186, 187
array controllers
adding to UI for data model, 121
binding columns to, 122
artwork
Icon Composer and, 6, 129
ideal, selecting for icons, 128
assertions, testing and, 279–280
Assistant
data models and, 125
in Editor area, 28–29
Interface Builder, 50, 54
viewing generated output and, 258–259
writing code and, 80, 87
Assistant windows, Jump Bar in, 26
auto-creating schemes, 180, 181
Autolayout, 63–69
activating, 64
basics, 63
constraints, 64–67, 68, 69
new functionality, 68–69
automated refactoring, 147–148
Automatic behavior (Assistant), 54, 125
Autosizing control, 59, 60, 61, 62
B
backtrace, viewing, 254
badges (status), 364
bar pointer, memory addresses and, 246, 247
bash shell, 303
behaviors
behavior modes (Assistant), 30, 87, 125
Behaviors menu, 229
Behaviors panel, 228
when creating workspaces, 228–230
beta versions, 315–321
bezel alert, creating, 230
bindings, Cocoa Bindings controller layer, 121, 122
Blame mode (Version Editor), 372
bookmarks, documentation pages and, 40
branches (Git), creating and switching, 369–370
Breakpoint navigator
basics, 24
runtime debugging and, 107
breakpoints
runtime debugging and, 106–107
vs. threads, 245
bt command, 254–255
Build action (schemes), 183–184
build environments, defining macros in, 316–321
build errors example, 101
Build Phases tab, 169–172, 206
Build Rules tab, 173–174
Build Settings sheet, 16
Build Settings tab, 165–168
build systems, 155–193
build phases, 158, 169–172
build rules, 158
Build settings, 157
configurations, 157
entitlements, 191–193
overview, 156–158
run destinations, 157
schemes. See schemes
targets. See targets
build time vs. runtime, 322
building applications, 17
bundles. See also loadable bundles
bundle identifiers, 12
defined, 198
similarity with libraries and frameworks, 196
button bar
Debug navigator, 242, 243
Navigator area, 20, 21
buttons, adding to UI for data model, 118–119
C
c command (console), 256
C preprocessor. See preprocessor
call tree (Instruments), 336, 341–342
case matching, searches and, 92, 95
Categories and Protocols behaviors (Assistant), 87
C/C++, Xcode 4 and, 3
change management, unit testing and, 273
checking out, 361–363
Clang Static Analyzer. See static analyzer
Class behavior (Assistant), 54
classes. See also subclasses
custom, for data model UI, 124
test classes, 278
as units, 272
cloning, 361–363
Cocoa Autolayout Guide, 66
Cocoa frameworks
application project windows, 14
Cocoa Bindings controller layer, 121
Core Data and, 112
document-based/plain applications, 13
Xcode 4 and, 3
Cocoa Fundamentals Guide, 49
Cocoa Touch Unit Testing Bundle option, 295–296
code. See also source code
adding (system framework example), 202–203
adding (third-party framework example), 207
adding when creating frameworks, 210–211
code completion, 256
code profiling tool. See Instruments
code-folding ribbon, 82
units, defined, 272
writing with Source Editor. See Source Editor, writing code with
Code Signing and Application Sandboxing Guide, 191
Code Snippet library, 85–86
colors, of issues, 100
com.apple.main-thread dispatch queue, 244
command sets, managing, 152
Command+Q for quitting iOS applications, 262
commands
categories of (debugger help), 257
console execution control commands, 256
committing
changes to repositories (SCM), 366–367
commits, Git vs. SVN, 356
community Web sites for help, 42
Company Identifier field, 12
company name, changing, 153
compartmentalization (nibs), 49
Compile Sources phase (targets), 170
compile time
compile-time debugging, 100–101
vs. runtime, 322
conditionals, preprocessor and, 315–316
CONFIGURATION variable, 310–311
configurations
Build Configuration pop-up, 184
build systems, 157
Configurations group (targets), 160
per-configuration settings (targets), 166
configuring snapshots, 352–353
console. See debugger console
constraints
Autolayout, 64–67, 68, 69
layout, 63
containers for schemes, changing, 227
continue-to-here, debugging and, 108
controllers
controller objects (nibs), 48
creating for data model UI, 121
controls
Apps controls (build systems), 193
Debugger Bar, 103
hardware controls (build systems), 192
memory view, 248, 249
positioning, 60–61
schemes, 182
sizing, 63
wiring for data model UI, 122
Convert to Objective-C 2.0 option, 148
Copy Bundle Resources phase, 170, 177
Copy Files phase (targets), 171
Copy Frameworks build phase, 224
Copy Headers build phase, 212, 213
Copy Headers phase (targets), 172
Copy PlugIns build phase, 171
copyrights, company name and, 153
Core Data, 112–113
Counterparts behavior (Assistant), 87
CPP (C preprocessor). See preprocessor
“Create a branch” sheet, 369
Create Snapshot sheet, 353
Create Superclass option, refactoring and, 147–148
custom classes, creating for data model UI, 124
custom find scopes, 92–94
customizing
behaviors, 229–230
debug behavior, 32
shortcuts, 151–152
D
dangling references, tracking down, 345–347
Data Model Editor, 111–125
Assistant and, 28, 125
basic data model, creating, 117
basic use of, 115–116
Core Data, 112–113
UI for data model, creating. See user interface for data model, creating
date
date formatter, adding to data model UI, 120
due date (data model UI), 117, 118, 122
Debug configuration, 157
Debug navigator, 24, 109, 242–243
Debugger Bar, 103–104
debugger console, 250–257
backtrace, viewing, 254–255
basics, 104–105, 250
code completion, 256
help, 257
objects and values, printing, 251–254
program execution, controlling, 256
debugging and analysis, 99–109, 233–269
for apps for iOS devices. See iOS devices, debugging apps for; iOS Simulator
Beta release scheme and, 321
compile-time debugging, 100–101
Debug navigator, 242–243
debugger console. See debugger console
generated output, viewing, 258–259
logic errors (static analyzer), 241
memory and, 246–249
memory leaks (static analyzer), 236
memory over-releases (static analyzer), 237–240
runtime debugging. See runtime debugging
scripts, 305
threads and stacks, 242–245
using (static analyzer), 234–235
#define directive, 313
defining macros, 313–314
definitions, jumping to, 152
deleting
files, 77
folders, 363
snapshots, 354
dependencies
automatic detection, 218
defining, 185
Find Implicit Dependencies option, 183
inter-project dependencies, 222–225
new targets, adding and, 176
subprojects and, 222
Target Dependencies build phase, 169, 177
deploying applications. See applications, deploying
Deployment Target group (targets), 160
-description method, 108
design of software, unit testing and, 273
Detail view (Instruments), 335–336
developer forums (Apple), 42
developer tools documentation, viewing, 39
Diagnostics tab (Run action), 186
discarding local changes (SCM), 373
dispatch queues, 244–245
document icons, setting, 133
document types
custom, 133
setting icons, 133
targets, 164
documentation
Documentation and API Reference menu item, 38
Documentation mode for Help, 39–40
reporting Apple documentation errors, 42
searching for text, 41
document-based applications, 13
downloading Xcode 4, 4
drag and drop
for adding files to projects, 72, 73
adding frameworks to projects with, 204
projects into workspaces and, 222, 223
script files, 304
snippets, 85
dSYM files, archiving and, 136
.dylib extension for libraries, 196
dynamic libraries, 196
E
Edit All in Scope command, 146, 149
editing
breakpoints, 24
snippets, 86
editing schemes, 181–190
Analyze action, 189
Archive action, 189
Build action, 183–184
Pre- and Post-actions scripts, 190
Profile action, 188
Run action, 184–186
scheme controls, 182
Test action, 186–187
Editor area
basics, 20, 27–29
Interface Builder, 51–52
editors
in Editor area, 27
split pane editors. See Assistant
embedding frameworks, 206
Encapsulate, refactoring and, 148
entities
adding, 117
Core Data and, 114
entity subclasses, creating, 124
entitlements (build systems), 191–193
environment variables, scripting and, 301, 305–306
errors, navigable, 283
events
common device events (iOS Simulator), 266–267
multi-touch events (iOS Simulator), 263
execution pointer, debugging and, 109
Explore mode (Organizer), 40
exporting
schemes, 180
snapshots, 354
expressions, testing, 280
Extended Detail view (Instruments), 336
Extract option, refactoring and, 147–148
F
File Template library, 76, 278, 287
files
Copy Files phase (targets), 171
entitlements, 192
File System pop-up (build systems), 192
files structure, built frameworks, 214
locating project files with Finder, 222
opening in Assistant, 29
owners (nibs), 48
searching within, 97
Xcode source files, 20
files, adding to projects, 71–76
creating new files, 74–75
existing files, 72–73
File Template library, 76
removing files, 77
fin command (console), 256
Find panel (Source Editor), 97
Find Scopes sheet, 92
Finder
finding archives and, 137
locating project files with, 222
viewing packages in, 138
finding
archives, 137
Find In option (Search navigator), 92
Find options (Search navigator), 91–92
leaks with Instruments, 342–344
projects’ targets, 160
system-defined symbols and macros, 314
Fix-it feature, 101
focusing on scopes, 82
folders
folder structure, built frameworks, 214
Folders option, for adding files, 73
managing in SVN, 363
media folders (build systems), 193
folding code, 83
Foo.framework, 204–207
Foundation.framework, 197
Framework Programming Guide, 206
frameworks
basics, 197, 199
Framework and Library sheet, 199
linking targets to, 161
similarity to libraries and bundles, 196
system framework example. See system framework example
third-party example, 204–207
frameworks, creating, 208–215
code, adding, 210–211
headers, configuring, 212–215
new framework projects, creating, 208–209
Free Pascal, 174
G
garbage collection, static analyzer and, 240, 347
GCC poison pragma directive (poison), 315
generated output, viewing, 258–259
Git
branches, 369–370
pushing changes and, 367
repositories, adding, 360
repositories, creating, 358–359
vs. SVN, 356, 360, 361
Grand Central Dispatch, 109, 244–245
graph mode (Data Model Editor), 116
H
hardware controls (build systems), 192
headers
configuring, when creating frameworks, 212–215
frameworks, adding code to and, 202
selecting correct, 207
umbrella headers, 207, 210–211
WebKit.h header, 202
Hello World action, adding, 55–56
help, 37–43
community Web sites for, 42
debugger console, 257
Help menu, 38
Organizer Documentation tab, 39–40
Source Editor, 41
user manual, 38
in Utility area, 41
Xcode help, 38
Help Indexer, 6
hiding schemes, 226
Hits Must option (Search navigator), 91
I
(IBAction)performSomeAction: (id)sender;, 48
(IBAction)performSomeOther Action:(id)sender;, 48
icons. See also application icons, customizing
creating, 129–130
document icons, setting, 133
icon file formats, 127
images
of icons, 129–130
PNG and TIFF, 128
importing schemes, 180
In-Call Status Bar (iOS devices), 267
Include Unit Tests option, 13, 208
Includes and Included By behaviors (Assistant), 87
indexes, project, 219
Info tab
targets, 162–165
Test action editor, 186, 187
TestApp target, 318
Info.plist file, 162–163
Inspection Range controls (Instruments), 330
Installer packages, 6
installing
Installer packages and, 6
Xcode 4, 4
instances, entities and, 114
Instruments, 325–348
basics, 5
dangling references, 345–347
Detail view, 335–336
DTrace overview, 326
Extended Detail view, 336
finding leaks, 342–344
instruments, defined, 326
Instruments view, 334
launching, 337–338
other capabilities of, 347
Profile action and, 188
Strategy bar, 332–333
templates, 188
time profiling with, 339–342
toolbar, 330–332
user interface, 327–329
Interface Builder, 50–54
Assistant, 54
Editor area, 51–52
Interface Builder Object library, 53
UI for data model, creating, 118
Utility area, 53
Xcode 4 and, 7
interfaces
single/multiple interface windows, 19
Source Editor, 80
iOS devices, debugging apps for, 260–269
applications, quitting, 262
debugging, 268
iOS Developer Program, 260
iOS project, creating, 260–262
iOS Simulator. See iOS Simulator
iOS Simulator, 263–268
basics, 5, 263
debugger and, 268
devices and versions, 264
multi-touch events, 263
rotation, 264–266
simulating common device events, 266–267
simulating TV Out, 267
iPads
hooking to projectors, 267
iOS Simulator and, 264
iPad Simulators run destinations, 262
iPhones. See also iOS devices, debugging apps for
In-Call Status Bar, 267
project settings, 261
run destinations, 262, 263
iPhoto app (simulated), 267
Issue navigator
basics, 23
failures in, 291
navigable errors and, 283
warnings, 15
issues
Activity Viewer and, 33
basics, 100
defined, 23, 100
logic issues, 241
static analyzer and, 234–235
J
Jump Bar
basics, 26
editing source code and, 81
Jump to Definition, 152
K
key bindings, changing, 151–152
keyboard shortcuts
Assistant panes, opening with, 29
behaviors shortcuts, 229, 230
breakpoints, setting with, 106
customizing, 151–152
tab use, speeding up with, 34
L
launching Instruments, 337–338
layout
Autolayout. See Autolayout
Autosizing control, 59
basics, 58
constraints, 63
data model UI, 118–120
layout behavior (Assistant), changing, 30
positioning, 60–61
sizing, 62
springs and struts, 59–63
leaks
finding with Instruments, 342–344
memory leaks, 236
levels settings (targets), 167–168
libobjc.a.dylib, 196
libraries
basics, 196
Code Snippet library, 85–86
defined, 196
File Template library, 76
Help, 38
ignoring unwanted, 40
Interface Builder Object library, 53
Link Binary With Libraries phase (targets), 170, 222
linking targets to, 161, 170
using, 199
Library control (Instruments), 331
Link Binary With Libraries phase, 170, 222
linking
against frameworks, 199, 205, 224
targets, 170
Lion
Autolayout and, 58, 63
document versions API, 185–186
low memory and, 342
upgrading to, 64
LLDB debugger, 250
loadable bundles, 198
Localizations group (targets), 161
Lock button, current memory view and, 248
Log mode (Version Editor), 372
Log navigator
basics, 25
debugging and, 101
output from scripts showing in, 302
test results log, 281–282
logic errors, static analyzer and, 241
logs, output from scripts showing in, 302
low memory warnings
iOS devices, 266
leaks and, 342
M
Mac OS X 10.7 (Lion)
Autolayout, 63–64
document versions API, 185–186
low memory and, 342
upgrading to, 64
macros
defining, 150, 313–314
preprocessor and, 316–321
uses for, 313–314
Manage Schemes sheet, 181
managed object contexts, 114
managed object model (MOM)
Core Data and, 113
in Data Model Editor, 115
in model graph mode, 116
managing
folders in SVN, 363
schemes (build systems), 179–181
snapshots, 354
source code. See source code management
Manual mode (Assistant), 30
manually generated output, viewing, 258
Match Case option (Search navigator), 92
memory
debugging and, 246–249
examining contents, 246–249
finding leaks and, 342
low memory warnings, 266, 342
memory addresses, zombies and, 345–347
memory leaks, static analyzer and, 236
memory over-releases, static analyzer and, 237–240
viewing, 248–249
merging changes (SCM), 368–369
methods
testing, 272, 274, 280
as units, 272
model layer, managing, 112
modernization of projects, 15–16
Modernize Loop option, refactoring and, 148
MOM (managed object model)
Core Data and, 113
in Data Model Editor, 115
in model graph mode, 116
mouse pointer, examining variables with, 108
Move Up/Move Down option, refactoring and, 148
multi-touch events (iOS Simulator), 263
N
names
company name, changing, 153
testing, 286, 292
naming. See also renaming
applications, 12–13
clones, 362
navigable errors, 283
navigating projects. See projects, navigating
Breakpoint navigator, 24
Debug navigator, 24
Issue navigator, 23
Log navigator, 25
Project navigator, 21
Search navigator, 23
Symbol navigator, 22
network communication (build systems), 192
New File sheet, 74
New Project options sheet, 12
New Project template sheet, 11, 260
New Scheme sheet, 180
New Target sheet, 175
next command (console), 256
.nib extension (NextStep Interface Builder), 48
nibs, 48–49
NSManagedObject subclass
creating custom, 124
generating accessor source code, 124
NSZombie, 345
O
objects
printing from console, 251–253
testing, 274, 279, 280
unit testing and, 272
OCUnit, 278–283
assertions, 279–280
navigable errors, 283
test results log, 281–282
test targets and classes, 278
Options bar (templates), 11
Options tab (Run action), 185–186
Organizer
preventing opening of, 309
Organizer Documentation tab for Help, 39–40
Organizer window
basics, 35
snapshots and, 354
orientation, changing (iOS devices), 264–266
outdated projects, modernizing, 15–16
outlets
nibs, 48–49
Outlets and Referencing Outlets behaviors (Assistant), 54
over-releases, memory, 237–240
owners (nibs), 48
P
p (NSUInteger)[[googleURL scheme] length] command, 253
PackageMaker, 6
packages, defined, 138
panes, adding and removing (Assistant), 29
Parallelize Build option, 183, 184
Pause/Continue button (Debugger Bar), 103
.pch file, for macros, 313
persistent stores, 113
Person class, adding for unit testing, 284–286
plug-ins, Copy PlugIns build phase, 171
PNG (.png) images, 128
poison, 315
positioning (layout), 60–61
positiveFlag variable, 241
post-action scripts
custom, 300–302
schemes, 190
post-Build-action actions, 301
pragma mark directive, 150, 313
pre- and post-action editor, 300–301
pre- and post-actions scripts
custom, 300–302
schemes, 190
preprocessor, 313–322
compile or build time vs. runtime, 322
conditionals, 315–316
macros, 150, 313–314, 316–321
poison, 315
previewing replacements, 95–96
printenv command, environment variables and, 305
printing objects and values, 251–254
probes, defined, 326
Product Name field, 12–13
Profile action (schemes), 188
program execution, controlling, 256
Project navigator, 21, 363, 365
project options sheet, 208, 209
projects
adding frameworks to, 204–207
adding to workspaces, 222
adding unit tests to, 295–297
inter-project dependencies, 222–225
iOS project, creating, 260–262
linking against frameworks, 199, 205
subprojects, defined, 222
projects, creating
building upon and running new projects, 17
modernization, 15–16
new framework project, 208–210
templates, 11
test project, creating, 12–14
Welcome to Xcode window, 10
projects, navigating, 19–35
Activity Viewer, 33
Breakpoint navigator, 24
Debug area, 20, 32
Debug navigator, 24
Editor area, 20, 27–29
Issue navigator, 23
Jump Bar, 26
Log navigator, 25
Navigator area, 21–25
Organizer window, 35
Project navigator, 21
Search navigator, 23
Symbol navigator, 22
tabs, 34
Utility area, 20, 31
workspace window, 20
Protocols behavior (Assistant), 87
provisioning iOS devices, debugging and, 268
pulling changes (SCM), 368–369
pushing changes (SCM), 367
Q
Quartz Composer, 6
queues, dispatch, 244–245
quitting applications, 262
R
Record and Target controls (Instruments), 330
Refactor tool, renaming symbols and, 96
refactoring
basics, 147–149
unit testing and, 273
References behavior (Assistant), 125
Referencing Outlets behavior (Assistant), 54
regular expression (regex) searches, 91
release builds, triggering scripts on, 310–311
Release configuration, 157
Release mode, 135–136
removing
actions, 301
Assistant panes, 29
breakpoints, 24, 106
files from projects, 77
schemes, 180
renaming
entities, 117
folders, 363
refactoring and, 147
renaming sheets, 148, 149
symbols, 96, 146
tabs, 34
unit tests, 274
reordering schemes, 180
Replace preview sheet, 95
replacing text (Search navigator), 94–96
repositories, 357–363
basics, 357–358
cloning and checking out, 361–363
creating, 358–359
manually adding, 359–361
restoring from snapshots, 355
reverting to earlier versions (SCM), 373
revision control. See source code management
rotation (iOS Simulator), 264–266
rules (build systems), 157
Run action (schemes), 184–186, 187
Run Archive Script build phase, 308
Run button, 17
run destinations (build systems), 157
run logs, 25
Run Script build phases
custom scripts, 300, 303, 306, 312
targets, 172
Runtime Classes behavior (Assistant), 125
runtime debugging, 102–109
basics, 102
console, 104–105
Debug navigator, 109
Debugger Bar, 103–104
Source Editor and, 108–109
using breakpoints, 106–107
runtime vs. build time, 322
S
s command (console), 256
sandboxing, 191–193
saving
icons, 130
workspaces, 221
scalars, testing, 279
Scheme Editor. See also editing schemes
Scheme Editor sheet, 181, 182, 319
tests in, 274, 291
unit testing and, 290
schemes. See also editing schemes
basics, 156
debugger attachment and, 102
managing when building macros, 319
in workspaces, 219, 226–227
schemes (build systems), 178–189
basics, 178
finding projects’ schemes, 178
managing, 179–181
scheme manager sheet, 179
Scheme selector control, 178
SCM systems, 356–373
branches, creating and switching, 369–370
committing, 366–367
comparing and browsing history, 370–372
folders, managing in SVN, 363
local changes, reverting and discarding, 373
pulling and merging changes, 368–369
pushing changes, 367
repositories, managing. See repositories
status, checking, 364–365
scopes
custom find scopes, 92–94
Edit All in Scope command, 146, 149
Find Scopes sheet, 92
focusing on, 82
screen savers, loadable bundles and, 198
scripting
environment variables and, 305–306
simple example, 307
scripts
creating, 308–309
debugging, 305
extending, 312
pre- and post-action scripts, 300–302
Run Script build phase, 300, 303–305
triggering on release builds only, 310–311
scrubber control (Instruments), 331
scrubbing revision timeline, 371
SDKs (software development kits), Xcode 4 installation and, 4
search and replace (project members and source), 89–97
Search navigator. See Search navigator
searching within files, 97
Search control (Instruments), 331
Search navigator, 90–95
basics, 23, 90
custom find scopes, 92–94
Find Options panel, 91–92
jumping to, 90
replacing text, 94–96
searches
build log search results, 302
options in Organizer, 40
searching documentation for text, 41
standard Help searches, 38
selection, defined, 30
self, printing, 252
Sent Actions behavior (Assistant), 54
SenTestingKit.framework, 278
Shake event (iOS devices), 267
sharing applications, 139
Shell field (Run Script action), 301, 303
shell script file template, 304
shortcuts. See keyboard shortcuts
-shouldAutorotateToInterface Orientation: method, 265
Show environment variables in build log check box, 303, 305, 306
Siblings behavior (Assistant), 87
sizing
of images, 128
layout and, 62–63
slider control (Debug navigator), 242, 243
snapping to guides for fixing constraints, 67
snapshots feature, 352–355
snippets
creating and editing, 86
examining and using, 85
software development kits (SDKs), Xcode 4 installation and, 4
source code
generating accessor source code, 124
navigating, 81–83
source code management
Git vs. SVN, 356
SCM systems. See repositories; SCM systems
snapshots, 352–355
Source Editor
analyzer issue highlighted in, 100
compiler issue highlighted in, 100
finding symbols and macros with, 314
Help and, 41
interacting with debugger, 108–109
managing breakpoints in, 106
navigable errors and, 283
search and replace with, 97
Source Editor, writing code with, 79–87
Assistant and, 87
code completion, 84
Code Snippet library, 85–86
interface, 80
source code, navigating, 81–83
split pane editor. See Assistant
Spotlight
Include Spotlight Importer option, 13
loadable bundles and, 198
springs and struts, 59–63
Autosizing control, 59
constraints, 63
positioning, 60–61
sizing, 62
SSH keys, setting up, 363
stacks. See threads and stacks
staging feature (Git), 366
STAssertEqualObjects() assertion, 279
static analyzer
Analyze action and, 189
analyzer results bar, 235
debugging and, 100
logic errors and, 241
memory leaks and, 236
memory over-releases and, 237–240
using, 234–235
static libraries, 196
status
SCM, checking. See Subversion (SVN)
status control (Instruments), 331
Step Into button (Debugger Bar), 103
Step Out button (Debugger Bar), 103
Step Over button (Debugger Bar), 103
STFail() assertion, 279
Strategy bar (Instruments), 332–333
structs, testing, 279
struts. See also springs and struts
defined, 59
Style option (Search navigator), 91
styles, in Data Model Editor, 116
subclasses
creating for entities, 124
refactoring and, 148
Subclasses behavior (Assistant), 87
subprojects, defined, 222
Subversion (SVN)
folders, managing in, 363
vs. Git, 356, 360, 361
locally hosted repositories, creating, 359
Summary tab (targets), 161–162, 163
superclasses
refactoring and, 147–148
Superclasses and Subclasses behaviors (Assistant), 87
SVN. See Subversion (SVN)
switching branches (Git), 369–370
Symbol navigator, 22
symbols
code completion, 84
finding, 314
finding documentation for, 41
moving between, 81
renaming, 96, 146
system framework example
code, adding, 202–203
importance of WebKit.framework, 203
linking against frameworks, 199
UI, adding, 200–201
T
table mode (Data Model Editor)
basics, 115, 116
table view control, adding to UI, 118–119
tabs
creating new, 34
as new Xcode feature, 34
Target Dependencies build phase, 169, 177
targets, 159–177
adding new, 175–177
basics, 156, 159
Build Phases tab, 169–172
Build Rules tab, 173–174
Build Settings tab, 165–168
Info tab, 162–165
project-wide settings, 160–161
selecting projects’ targets, 160
Summary tab, 161–162, 163
test targets, 215, 278
templates
basics, 9
creating new projects and, 11
defined (DTrace), 326
projects, creating new, 11
target template chooser, 159
target template sheet, 175
terminology, Git vs. SVN, 356
TestFoo class, 211
testing. See also OCUnit; unit testing
applications, 139
data model UI, 123
icons, 130
integration testing, 273, 274
Test action (schemes), 186–187
test case class, 287
TestAppTouchTests test target, 295–297
testing bundle, 295, 296
text
replacing with Search navigator, 94–96
searching, 91
searching documentation for, 41
text fields, adding, 57
third-party framework example, 204–207
threads and stacks
Debug navigator and, 109
debugging and, 242–245
minimal, full, and semi-filtered stacks, 243
suspending threads, 245
threads vs. breakpoints, 245
Threads and Stacks navigator, 104, 105
Threads strategy (Instruments), 332–333
TIFF (.tif) images, 128
time profiling
with Instruments, 339–342
Time Profiler, 308–309
to-do items (basic data model), 117–118, 121, 123
toolbar (Instruments), 330–332
tools. See Xcode Tools
Top Level Objects behavior (Assistant), 54
tracing. See also DTrace
defined, 326
TV Out, simulating (iOS Simulator), 267
U
UIKit.framework, 197
umbrella headers
basics, 207, 210–211
defined, 210
Uniform Type Identifiers (UTIs), defining, 164
unions, testing, 279
unit testing, 271–297
adding to projects, 295–297
basics, 271–272
benefits of, 273
controversy over, 275
Include Unit Tests option, 13, 208
vs. integration testing, 273, 274
limitations of, 274
OCUnit and. See OCUnit
Person class, adding, 284–286
Test action and, 187, 276
TestAppTests, 276–277
tests, designing, 286
tests, passing, 292–294
tests, testing 291
tests, writing, 287–290
units, defined, 272
unlocking, debugging iOS devices and, 268
updating changes (SCM), 368–369
URLs, defining (targets), 165
user interface for data model, creating, 118–125
accessors, creating, 124
controllers, creating, 121
custom classes, creating, 124
layout, 118–120
testing, 123
wiring controls, 122
user interface (Instruments), 327–329
user interfaces (UIs), creating, 47–69
elements, basics of adding, 55
Hello World action, adding, 55–56
Interface Builder. See Interface Builder
layout. See Autolayout; layout
nibs, 48–49
system framework example, 200–201
text fields, adding, 57
user manual (Help), 38
user-defined build settings, 168
Utility area
basics, 20, 31
Help in, 41
Interface Builder, 53
UTIs (Uniform Type Identifiers), defining, 164
V
validating apps, 139
values, printing from console, 251, 253–254
variables
environment variables, scripting and, 301, 305–306
inspecting in Source Editor, 108
Variables pane, 105
Variables view (Debug area), 246
version control. See source code management
Version Editor, 370–371
Version Editor mode (Source Editor), 80
versions in repository, comparing and browsing history, 370–372
View controls (Instruments), 331
W
warnings
beta warnings, 316, 319, 321, 322
issues and, 101
low memory warnings, 266, 342
of outdated project settings, 16
watches, setting, 246–247
Web sites for downloading Foo.framework, 204
Web sites for further information
appendixes to book, xi
C preprocessor, 313
Clang Static Analyzer, iv, 100
Cocoa Autolayout Guide, 66
Cocoa Fundamentals Guide, 49
Code Signing and Application Sandboxing Guide, 191
Git, 356
Grand Central Dispatch, 244
Help, 42
OCUnit, 278
print, 254
SSH keys, setting up, 363
SVN, 356
Xcode shortcut cheat sheet, iv
WebKit.framework. See system framework example
Welcome to Xcode window, 10
windows. See also specific windows
single/multiple interface windows, 19
workspace window, 20
workspaces, 218–231
adding, 228–230
basics, 218–219
defined, 218, 228
true, 217
when to use, 220
workspaces, creating, 221–227
basics, 221
inter-project dependencies, 222–225
projects, adding to workspaces, 222
schemes, in workspaces, 226–227
writing
code. See Source Editor, writing code with
unit tests, 287–290
X
.xcarchive format, 138
Xcode Archive format, 138
Xcode 4
advantages of, xii
installing, 4
obtaining, 4
relationship to Xcode Tools, 3
Xcode integrated development environment (IDE), 5
Xcode Tools
basics, 3
relationship to Xcode 4, 3
tools, listed, 5–7
.xcodeproj files, 217
.xib (XML Interface Builder), 48
xibs, 48–49
Z
zipping, packages or bundles and, 139
zombies, killing, 345–347
Appendixes
Appendix A. Managing Your iOS Devices
If you’re developing for iOS, sooner or later you’ll want to test your apps on physical devices to make sure they work properly before submitting them to the App Store. To do this, you must provision your devices for use in development. Provisioning requires a current iOS Developer account and enables you to install and debug your own applications as well as access the device’s console logs, screenshots, and more. In this appendix, you’ll learn how to link Xcode to your developer portal, provision your devices for development, and generally manage the device.
Using the Organizer’s Devices Tab
The Organizer’s Devices section (Figure A.1) lets you manage the iOS devices you use for development as well as your provisioning profiles, software images, application data, console logs, and screenshots. In this section of the Organizer, you can automatically provision devices for development, letting you run and test applications on the device rather than only in the Simulator. To open the Organizer, choose Window > Organizer from the main menu, and then click the Devices tab in the Organizer toolbar.
Figure A.1 The Organizer’s Devices tab
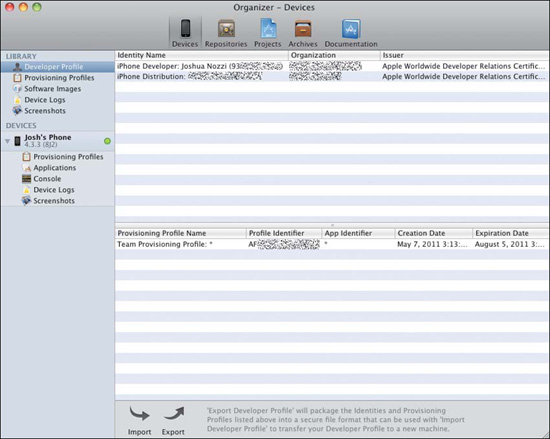
Figure A.1 shows a single device—my iPhone—as well as the developer and provisioning profiles pulled from an active iOS Developer account. The green indicator next to “Josh’s Phone” shows that the device is provisioned and ready for use in development.
Provisioning a Device
In order to run and test your applications on an actual iOS device (as opposed to the Simulator), you’ll need to provision your device for development. Provisioning involves obtaining the proper certificates from your Apple Developer account through their Provisioning Portal site and installing them onto your devices. This is necessary for a device to allow applications that didn’t come from the App Store to be installed on the device. If you have a current Apple iOS Developer Program membership, provisioning can be simple in Xcode 4.
Most developers will need only to open the Devices tab of the Organizer and plug in the device. When the device appears in the list, select it and then click the Use for Development button (Figure A.2).
Figure A.2 A device in the Devices tab of the Organizer
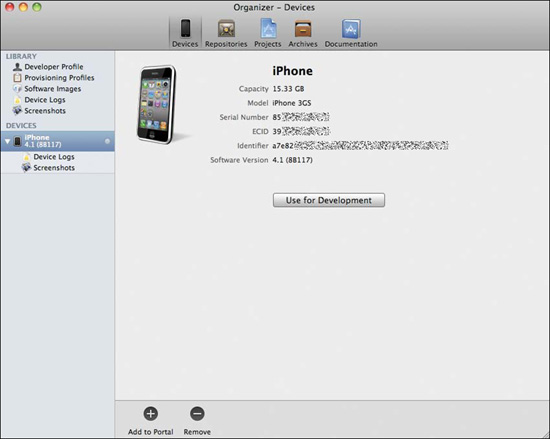
You may at this point be asked for your Apple iOS Developer Program credentials. (Figure A.3). Provide your information and click Log In. You may also be informed that no development certificate was found (Figure A.4) and asked if you would like to request one. Click Submit Request to submit the request automatically and obtain the needed certificates.
Figure A.3 Logging in to your Apple Developer account
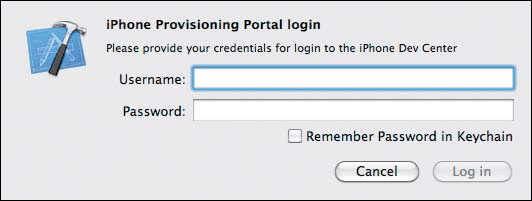
Figure A.4 Prompting to request a certificate
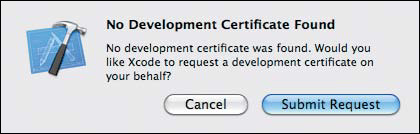
Once you’ve made it through the various hurdles, the device will be analyzed and provisioned automatically. The indicator dot to the right of the device in the list will turn green, informing you that your device is ready for development use. You should now be able to run your iOS applications on the device itself by choosing the device in the Schemes pop-up in the workspace window’s toolbar and pressing the Run button.
In addition to automatic provisioning, you can import and export developer and provisioning profiles by using the Import and Export buttons at the bottom of the window with either Developer Profile or Provisioning Profiles selected in the list. This is useful for manually provisioning or for moving your profile to a different computer. You will be required to set a password upon export and use the same password on import to protect the private key used to sign your applications cryptographically (referred to as code signing).
Note
Apple has done an excellent job automating this cumbersome process in Xcode 4. Nevertheless, it does not always work correctly. Read the guidelines supplied in the Provisioning Portal site found under your iOS Developer account to help you figure out what went wrong and how to complete the process manually.
Installing iOS on a Device
During development, it is sometimes necessary to install different versions of iOS on your device for compatibility testing. This includes beta versions of iOS itself, to which you have access via the iOS Developer Program. iOS versions are downloaded from the Apple Developer site (http://developer.apple.com).
To install a different version of iOS on a device, make sure the device is plugged in and selected in the list that appears in the Devices tab of the Organizer. You can then select a version from the Software Version pop-up just below the device information. If your version does not appear in the list, choose Other Version from the pop-up and locate the iOS package you downloaded. Click the Restore button and confirm the action in the confirmation sheet, then wait for the iOS version to be installed (restored). When the installation is complete, reactivate the device and restore its contents using iTunes (just as you’d do as an end user).
Managing Device Screenshots
The Devices section of the Organizer also lets you manage the screenshots you take with your device. Screenshots can be located by selecting the Screenshots entry under the desired device in the Organizer list (Figure A.5). Screenshots are useful for two reasons: as marketing material for the App Store or your own Web site, and as a “default launch image,” which users see as the application is launching on their device.
Figure A.5 The device screenshots list
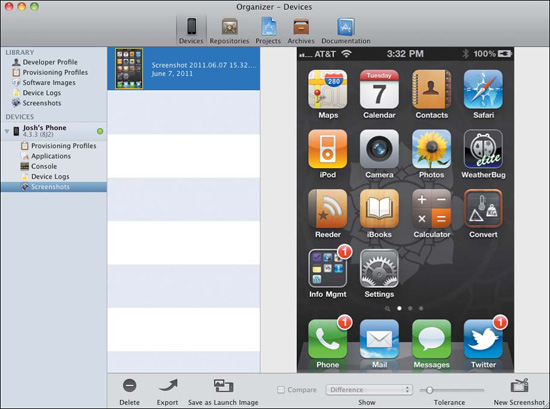
Taking Screenshots
You can take new screenshots by clicking the New Screenshot button in the lower-right corner of the window. All screenshots are listed as time-stamped thumbnails. Selecting a thumbnail will display the full-size image to the right of the thumbnails list. This image may be scaled down to fit the window (this is especially useful if you have a small display and are viewing screenshots taken from a device with a much higher-resolution Retina display).
Comparing Screenshots
You can compare screenshots by selecting two or more images and selecting the Compare check box at the bottom of the window (Figure A.6). Choosing Difference from the pop-up to the right of the check box shows only the differences between the selected screenshots. You can adjust the tolerance (how much of a difference is required for a pixel to be visible in Difference mode) by using the slider to the right of the pop-up. Figure A.6 shows the difference between two screenshots (dock badges and signal strength fluctuations).
Figure A.6 Comparing screenshots
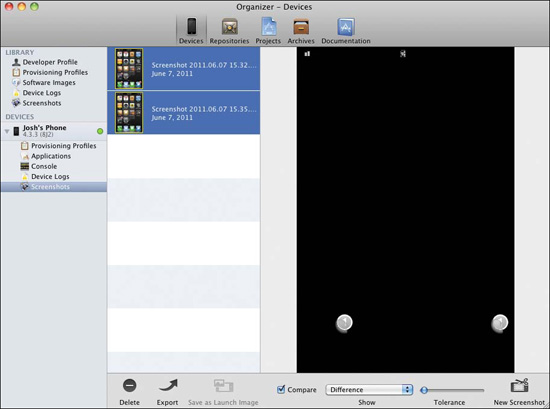
Using a Screenshot as the Default Image
To use a screenshot as the default launch image for an iOS application, select it from the thumbnails list and click Save as Launch Image at the bottom of the window. You’ll be prompted to give the launch image a name and to select a workspace to which to add the image (Figure A.7).
Figure A.7 Naming the image and selecting a workspace
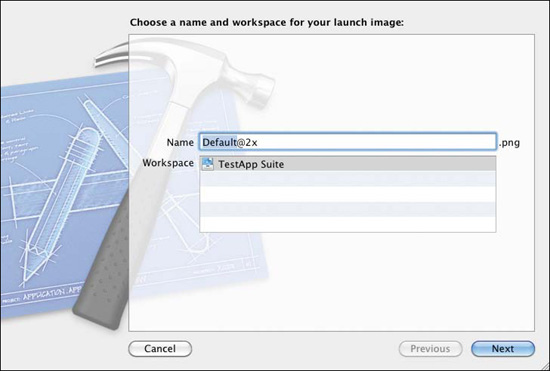
If there is more than one target in the workspace, you’ll need to click Next to choose the target for which you want to set the default image (Figure A.8). Xcode will guess the target or targets to which you intend to add the image; you may need to change the selection using the check boxes. Make your selection, then click Finish. The screenshot will be added as the default launch image for the selected target.
Figure A.8 Choosing a target for the default image
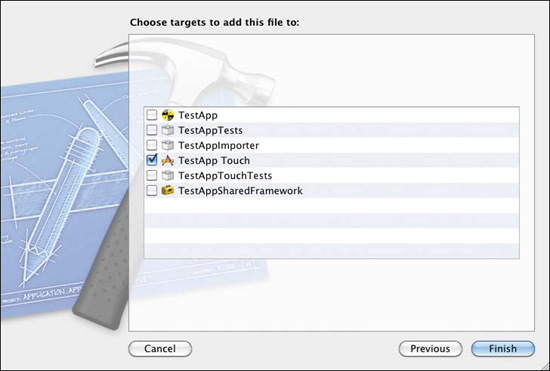
Note
A workspace containing an iOS application must be open in order to select it in the Save as Launch Image sheet.
Managing Apps and Data
The Devices tab of the Organizer gives you a simple interface for adding and removing applications you’re developing as well as for downloading the applications’ data. To manage the applications, select the Applications entry under the desired device in the Organizer list (Figure A.9).
Figure A.9 The device applications list
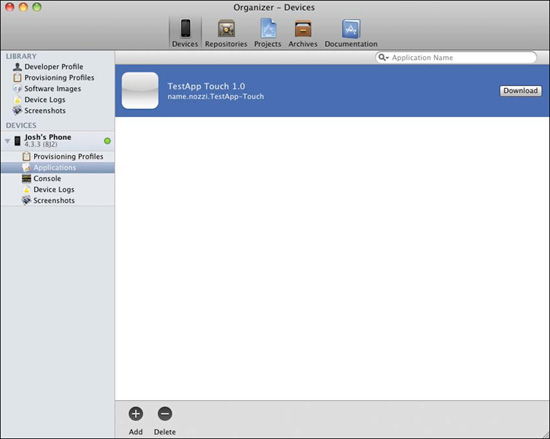
Installing and Removing Apps
You can install applications by clicking the Add button and selecting the application bundle to add. You’ll need to have a provisioning profile for the application (which is usually only an issue if a friend is letting you test one of their applications).
To uninstall, select the desired applications in the list and click the Delete button. The applications and their associated data will be removed from the device.
Downloading Application Data
You can download an application’s data for safekeeping (or analysis) by locating it in the list and clicking the Download button to its right. Choose a location to which to save the data and a folder will be created at that location containing the application’s data and settings. Only applications for which you have a provisioning profile will allow you to download their data.
Reviewing Logs
When running an application on the device without the benefit of an attached debugger, application crashes are a mystery. The logs of all connected devices can be accessed through the Device Logs section in the Devices tab of the Organizer. You can get the logs of individual devices by choosing the Device Logs entry under the desired device (Figure A.10).
Figure A.10 The device logs
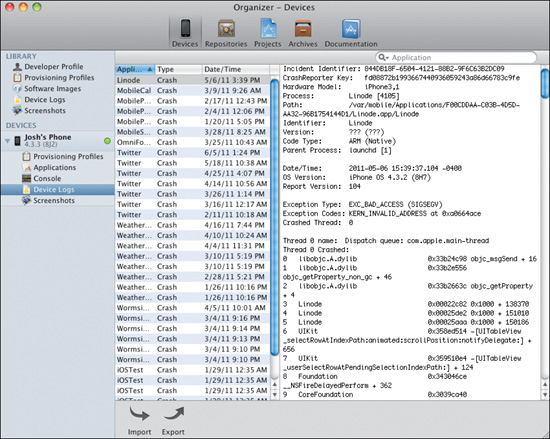
A device’s console log is available under the Console entry under the desired device (Figure A.11). The console log can reveal useful information about an application that was running on its own, outside of a debugging session.
Figure A.11 The device console log
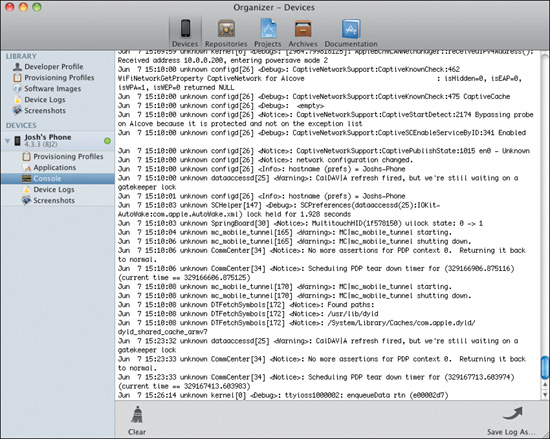
Appendix B. Gestures and Keyboard Shortcuts
Xcode 4 comes with a number of standard keyboard shortcuts and multi-touch gestures. This appendix contains a list of both.
Gestures
Xcode 4’s multi-touch gesture support is limited to standard two-finger scrolling and three-finger left or right swipes to navigate—similar to using the back and forward buttons in the Jump Bar.
Keyboard Shortcuts
Following is a list of the default keyboard shortcuts in Xcode 4, grouped by category.
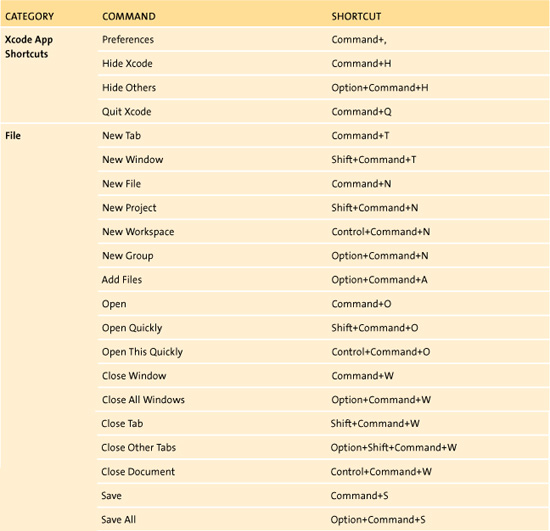
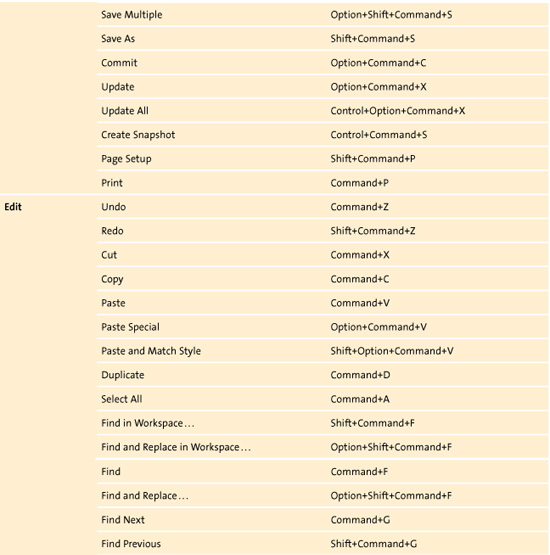
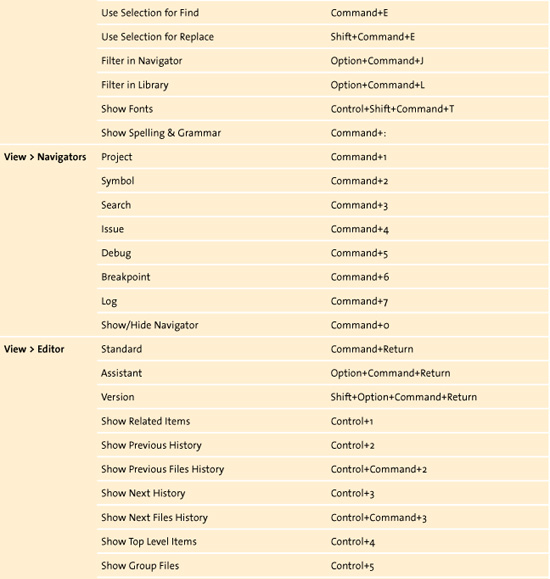
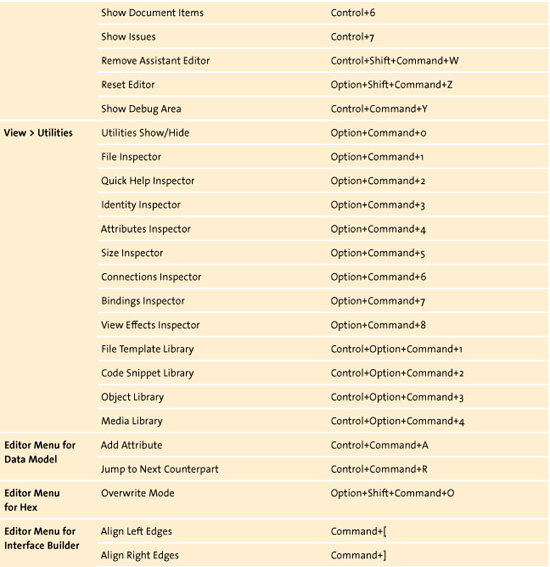
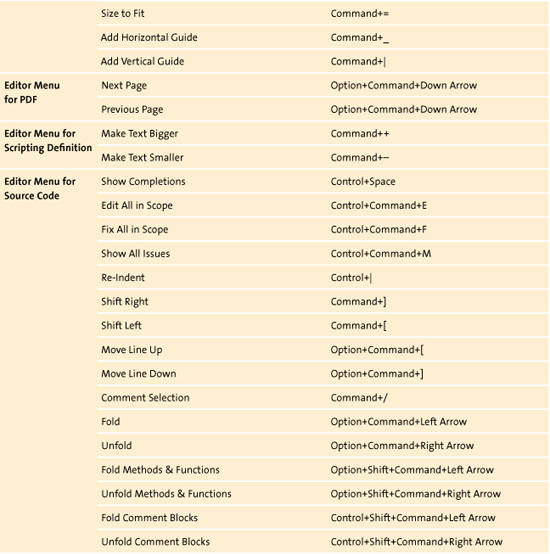
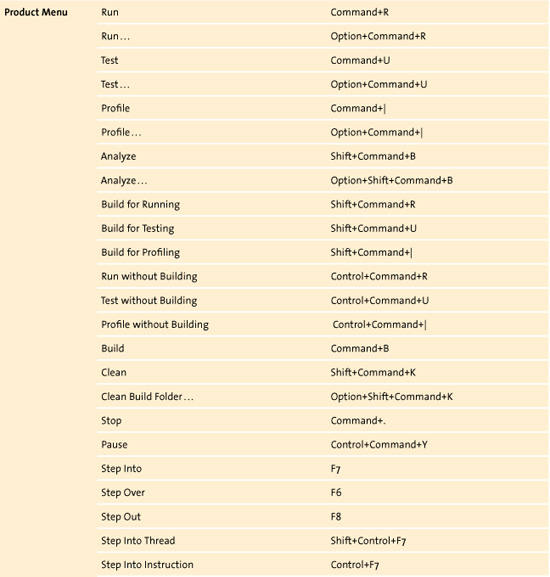
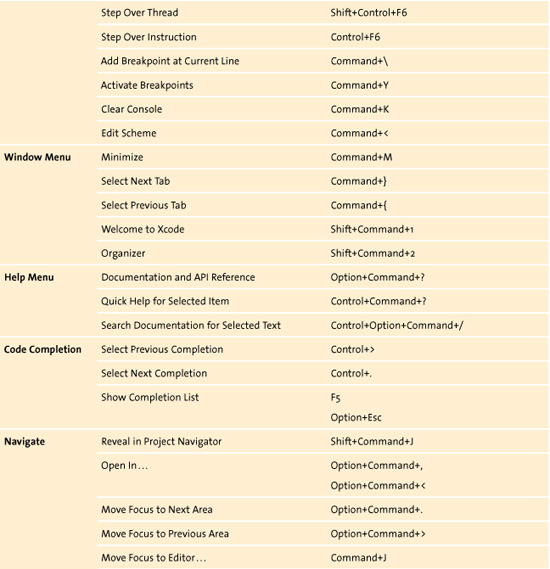
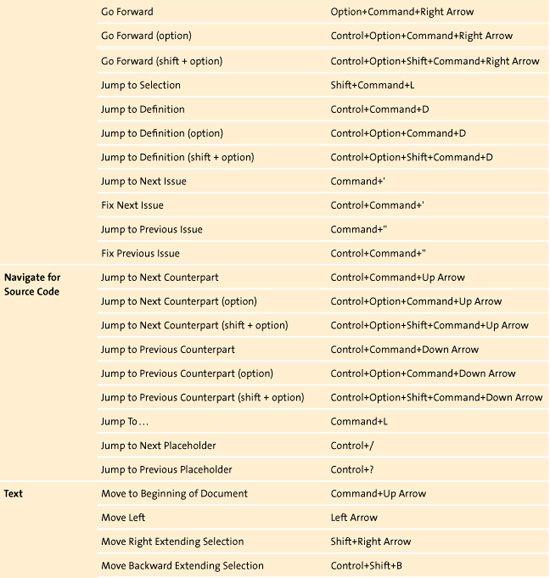
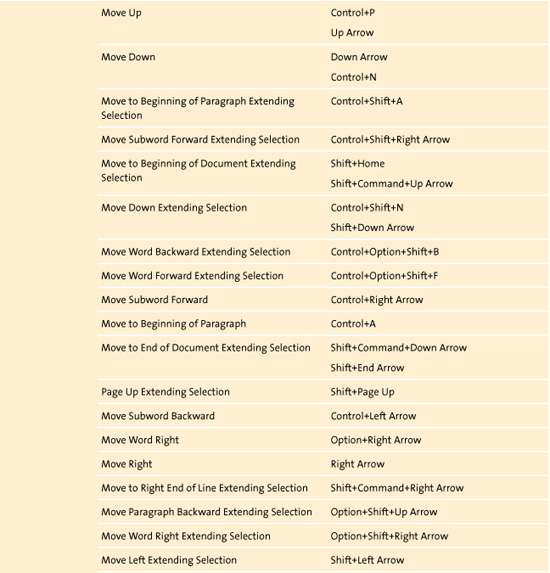
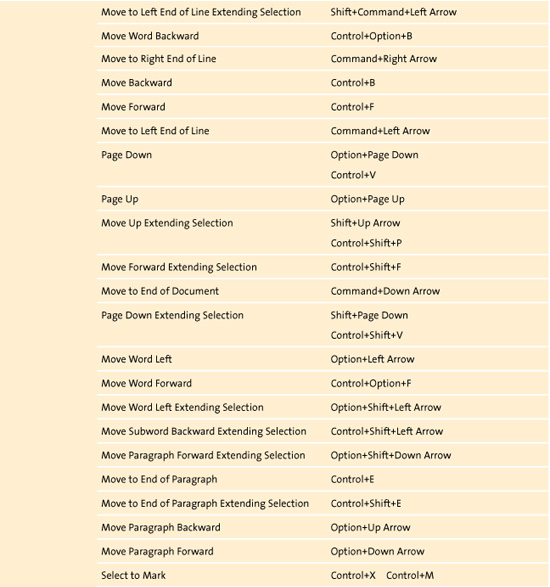
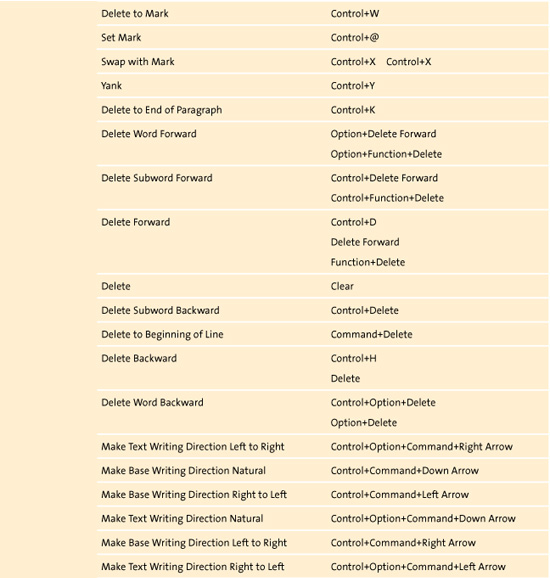
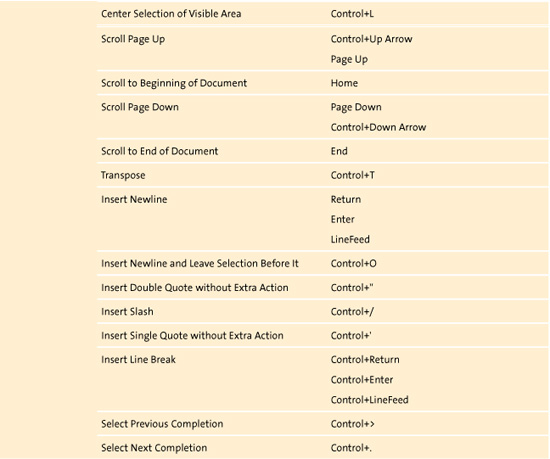
Editing Keyboard Shortcuts
Keyboard shortcuts can be customized using Xcode’s Key Bindings preferences. To access these preferences, choose Xcode > Preferences from the main menu, then select the Key Bindings tab.
Figure B.1 shows the Key Bindings preferences. You can create your own command sets (a set of customized keyboard shortcuts) by using the Add (+) button at the bottom of the list to create a new set. You can then edit each shortcut by double-clicking its Key field and pressing the keyboard shortcut (the combination of keys) you wish to trigger the event. The list can be filtered using the search field or by selecting one of the categories (All, Menu, or Text) from the bar above the list.
Figure B.1 Key Bindings preferences
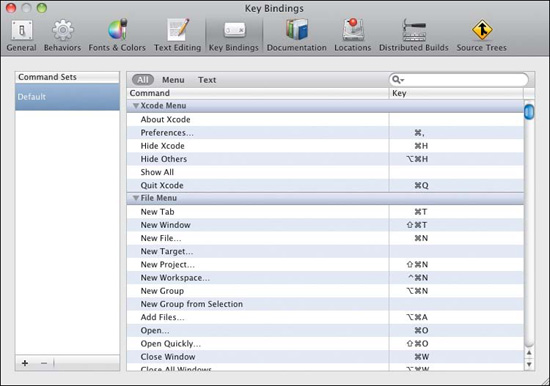
Appendix C. Documentation Updates
Xcode automatically downloads and installs documentation updates in the background. In addition, you can control the installed documentation sets and check for updates manually. This is controlled through the Documentation preferences panel.
Setting Documentation Preferences
To open the Documentation preferences panel, choose Xcode > Preferences from the main menu, then select the Documentation tab. Figure C.1 shows the preferences.
Figure C.1 The Documentation preferences panel
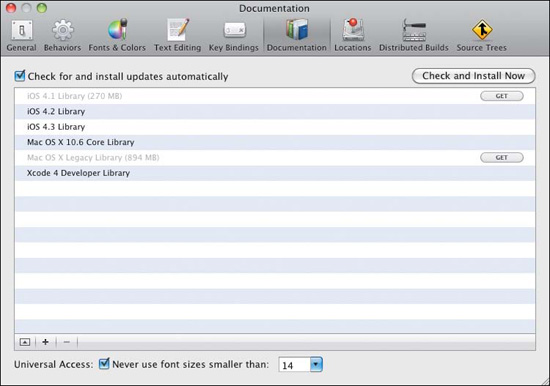
Xcode downloads only what it considers “necessary” documentation sets at first. If you want missing libraries (the ones that are grayed out), you’ll need to press the GET button beside them. Xcode will download and install the documentation set and, from that point forward, will include those sets in its automatic update checks.
Additionally, you can add third-party documentation sets using the Add (+) button at the bottom of the list. The documentation must come from an http:// or feed:// URL.
You can view information about the selected document set by pressing the disclosure button to the left of the Add button, as in Figure C.2. Finally, you can disable automatic updating and force update checks by using the controls just beneath the toolbar. The check box toggles the automatic updates, and the button forces a check and install immediately.
Figure C.2 The documentation set information panel
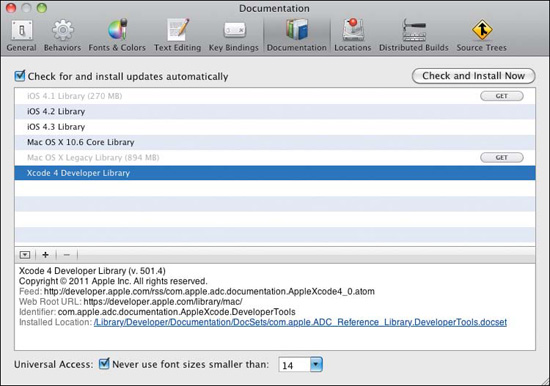
Appendix D. Other Resources
There are a number of helpful online resources for learning to use Xcode and for Cocoa development in general. A few author favorites are listed here.
The Book Site
This book’s companion site (http://xcodebook.com) contains Xcode 4 news, tips and tricks, downloadable sample projects reflecting each chapter’s tasks, and errata.
Apple Resources
Developer Forums (http://devforums.apple.com)
Apple’s developer forums site has an Xcode-specific forum with a number of active members. A current Apple Developer account is required.
Xcode-Users Mailing List (http://lists.apple.com/mailman/listinfo/xcode-users)
The Xcode-Users mailing list doesn’t require an Apple Developer account to use and is an active list full of helpful people.
Third-Party Resources
Stack Overflow (http://stackoverflow.com/questions/tagged/xcode)
Stack Overflow is a great developer resource with questions tagged by topic. Questions and answers are voted up or down depending on their clarity and usefulness, encouraging thoughtful questions and answers by community members.
CocoaDev Wiki (http://cocoadev.com)
Although somewhat dated, this community-built wiki was pumped full of useful Cocoa developer information over the course of the last decade and still contains many valuable lessons for beginner, intermediate, and expert developers.
Cocoa Dev Central (http://cocoadevcentral.com)
This celebrated collection of informative how-to articles contains many Cocoa developer favorites. It’s worth browsing.


Note: CD-ROM/DVD and other supplementary materials are not included.
Xcode 4 has a brand new user interface, built upon proven technologies that Apple itself uses to build Mac OS X and iOS, and that have produced over a quarter million Mac OS X and iOS apps.
This project-based book introduces readers to Apple’s development environment. The book is aimed at new Mac OS X and iOS developers and assumes the reader is familiar with programming and object-oriented concepts. The book starts at the basics—how to download, install, and start using Xcode—and moves to a detailed look at building and running applications. The last part of the book covers more advanced topics, such as testing, debugging, and source-code management. With the book’s approach, readers will be able to take the projects they build during the book and adapt them for use in their own projects.